


[[ data.name ]]
[[ data.ticker ]]
[[ data.price ]] [[ data.change ]] ([[ data.changePercent ]]%)
Niski: [[ data.low ]]
Wysoki: [[ data.high ]]
O
Historia
Różnice między inwestowaniem a handlem
O
Historia
Różnice między inwestowaniem a handlem
The ESP35 index is a stock market index that represents the performance of the 35 largest companies listed on the Spanish Stock Exchange. The index is calculated based on the prices of the stocks in the index, and is widely used as a measure of the Spanish economy. It was introduced in 1992, and since then has been used by investors to track the performance of the Spanish stock market.
As any other famouse indices such as the Germany 40, US 30 or SPX500, it is a capitalization-weighted index, meaning that the larger companies have a greater impact on the index. It is also rebalanced every year to ensure that it remains representative of the Spanish stock market. As of 2019, the total market capitalization of the ESP35 was over €1 trillion.
The ESP35 is the stock market index of Spain. It is a capitalization-weighted index composed of the 35 most liquid Spanish stocks traded on the Madrid Stock Exchange. The index is reviewed and adjusted every three months. As of December 31, 2020, the ESP35 had a base value of 100 points and was at 9,636.48 points.
The highest point ever reached by the ESP35 was 15,920.20 points on October 16, 2007. The lowest point was 6,735.10 on March 9, 2009. The index rebounded quickly after hitting its lowest point and has been steadily rising since then.
There are a number of important events that have affected the ESP35 over the years. In 2011, the European debt crisis caused the index to lose nearly 20% of its value in just a few months. In 2012, the introduction of new government policies helped to stabilize the index and it gradually began to recover. In 2017, concerns about Catalonia's independence bid caused another sharp drop in the index but it recovered soon after.
The ESP35 is an important indicator of Spain's economic health and is closely watched by investors around the world. It is expected to continue to rise in value in the coming years as Spain's economy continues to grow.
The index is reviewed every quarter, and companies are ranked according to their market capitalization. The components of the ESP35 are not static; rather, they are constantly changing as some companies outperform others and move up in ranking while other companies fall behind and are replaced. As such, the ESP35 provides a snapshot of Spain's top companies at any given time and can be used to measure changes in the country's economy.
While it is comprised of many different types of companies, it is dominated by banks and retailers such as Banco Santander, Repsol, Iberdrola, etc. In recent years, however, there has been a shift towards more tech-focused firms, with several new additions to the index coming from the software and telecommunications industries.
This change reflects Spain's evolving economy and its move towards a more digital future.
| Swap dla długiej pozycji | [[ data.swapLong ]] punkty |
|---|---|
| Swap dla krótkiej pozycji | [[ data.swapShort ]] punkty |
| Minimalny spread | [[ data.stats.minSpread ]] |
| Średni spread | [[ data.stats.avgSpread ]] |
| Minimalny rozmiar kontraktu | [[ data.minVolume ]] |
| Minimalny krok | [[ data.stepVolume ]] |
| Prowizja i swap | Prowizja i swap |
| Dźwignia | Dźwignia |
| Godziny handlu | Godziny handlu |
* The spreads provided are a reflection of the time-weighted average. Though TradingMoon attempts to provide competitive spreads during all trading hours, clients should note that these may vary and are susceptible to underlying market conditions. The above is provided for indicative purposes only. Clients are advised to check important news announcements on our Economic Calendar, which may result in the widening of spreads, amongst other instances.
The above spreads are applicable under normal trading conditions. TradingMoon has the right to amend the above spreads according to market conditions as per the 'Terms and Conditions'.
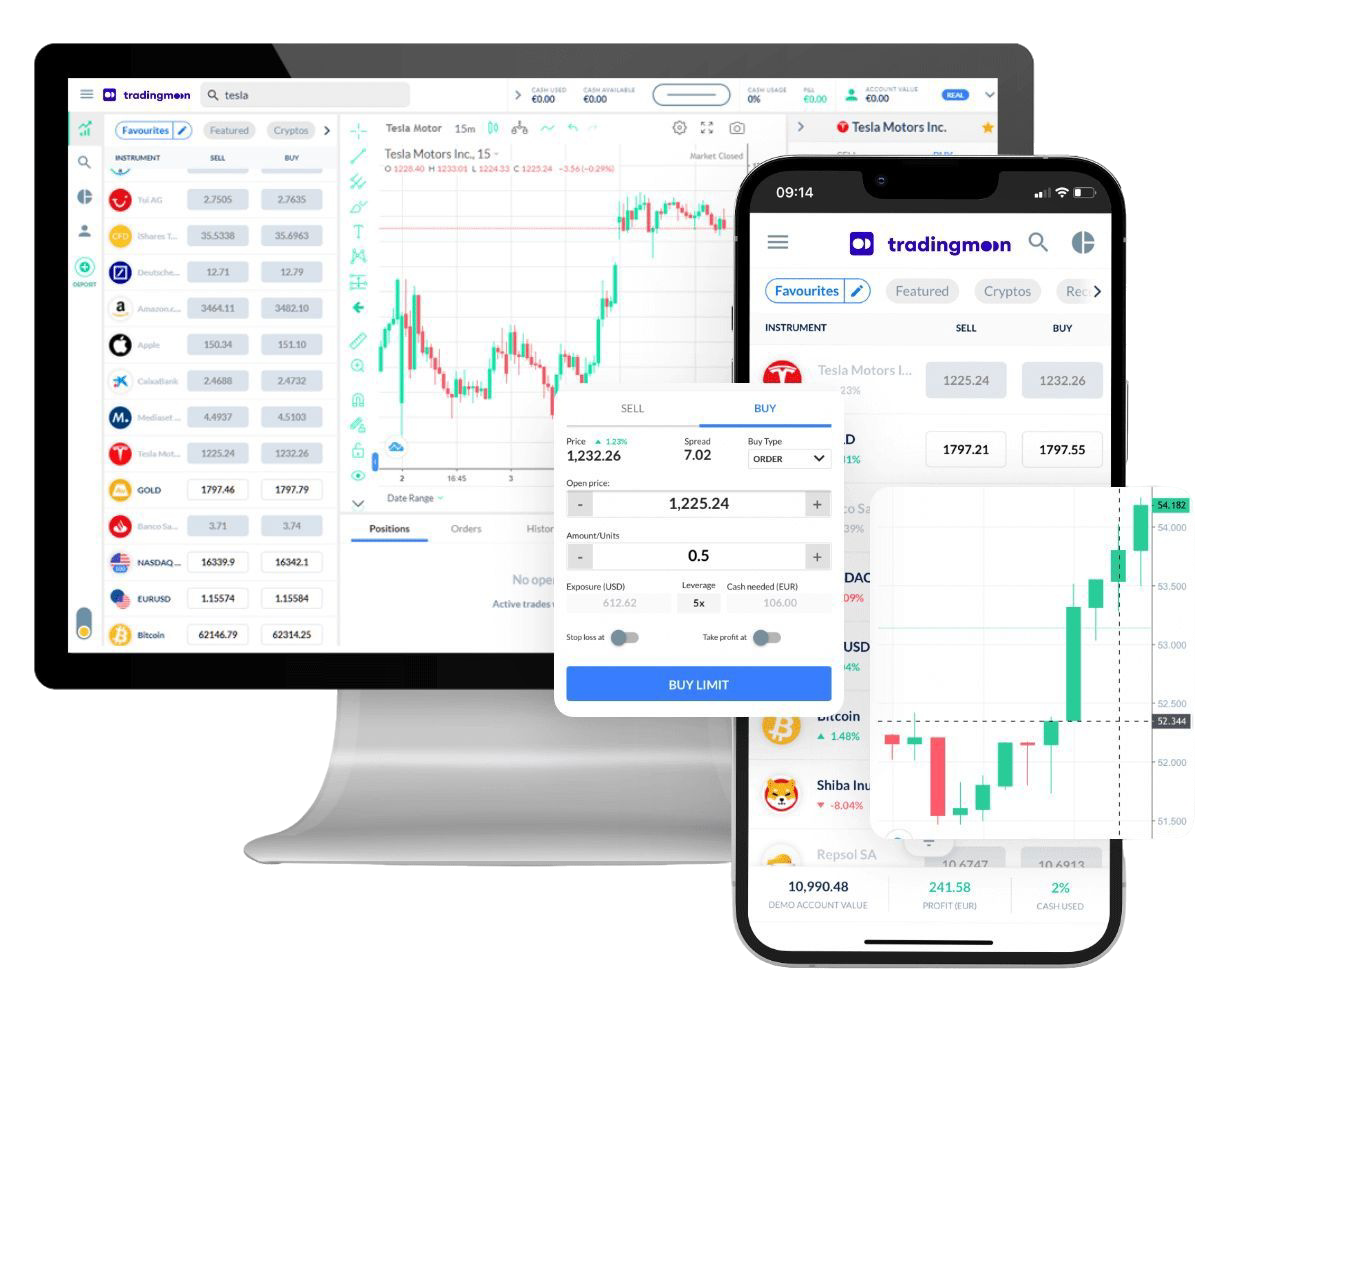
Handluj [[data.name]] z TradingMoon
Wszystkie główne indeksy w najlepszych w branży cenach.
Uzyskaj ekspozycję na rynki światowe dzięki indeksom giełdowym o niższym ryzyku.
- Handluj 24/5
- Minimalne wymagania dotyczące depozytu zabezpieczającego
- Najciaśniejsze spready
- Łatwa w użyciu platforma
Dlaczego warto handlować [[data.name]]
Wykorzystaj w pełni fluktuacje cen – bez względu na kierunek, w którym cena się zmienia i bez ograniczeń kapitałowych, które wiążą się z zakupem aktywów bazowych.
CFD
Indeksy

Zarabiaj na rosnących cenach (zajmij pozycję długą)


Wykorzystaj spadające ceny (zajmij pozycję krótką)

Handluj z dźwignią
Zajmuj większe pozycje niż gotówka, którą masz do dyspozycji

Handluj na zmienności
Nie musisz być właścicielem aktywu

Brak prowizji
Tylko niskie spready

Zarządzaj ryzykiem za pomocą narzędzi na platformie
Możliwość ustawienia poziomów take profit i stop loss