


[[ data.name ]]
[[ data.ticker ]]
[[ data.price ]] [[ data.change ]] ([[ data.changePercent ]]%)
Niski: [[ data.low ]]
Wysoki: [[ data.high ]]
O
Historia
Różnice między inwestowaniem a handlem
O
Historia
Różnice między inwestowaniem a handlem
Abbvie (ABBV.US) is a renowned American pharmaceutical company with a current market cap of $260.22 billion as of 29th August 2023. It was founded in 2013 as a spinoff from Abbott Laboratories, a well-established healthcare corporation. Since its inception, it has focused on research-based biopharmaceuticals for the treatment of chronic diseases.
The company has a rich history of impactful contributions to the medical field. Abbvie's success can be attributed to its dedication to innovation and commitment to improving patient outcomes. Today, it is ranked among the largest biomedical companies globally. With a diverse portfolio of medications distributed worldwide, the company continues to make significant strides in advancing healthcare and improving lives.
The stock price of AbbVie has seen some significant movements over the past five years. In March 2020, the company's stock hit its lowest point at $62.55, likely reflecting the overall market turmoil caused by the COVID-19 pandemic. On the other end of the spectrum, the stock reached its highest point in April 2022, when it climbed to $175.91.
One example of a strategy that traders may use is day trading. This approach involves buying and selling stocks within a single day, aiming to take advantage of small fluctuations in price. Day traders may use tools like the Relative Strength Index (RSI) to help identify overbought or oversold conditions that may indicate a potential shift in the stock's direction. Another approach is swing trading, which involves holding on to a stock for a few days or weeks to capitalize on longer-term price trends. Traders may use indicators like Bollinger Bands to help identify trading ranges and potential price breakouts.
While Abbvie is a leading pharmaceutical company, it's not the only player in the game. Before trading the stock, it's important to consider who its competitors are. They include but are not limited to:
- Johnson & Johnson (JNJ.US): Johnson & Johnson is a multinational medical and pharmaceutical conglomerate. Founded in 1886, it's known for its wide range of products, from consumer healthcare goods to pharmaceuticals and medical devices.
- Pfizer (PFE.US): Pfizer is a global pharmaceutical corporation established in 1849. It's one of the world's largest pharmaceutical companies, producing medicines and vaccines across various therapeutic areas, including oncology, immunology, and rare diseases.
- Merck & Co. (MRK.DE): Merck & Co is a leading global pharmaceutical company founded in 1891. It specializes in developing innovative medicines, vaccines, and animal health products. The company's diverse portfolio spans various therapeutic areas, including oncology, cardiovascular disease, and infectious diseases.
| Swap dla długiej pozycji | [[ data.swapLong ]] punkty |
|---|---|
| Swap dla krótkiej pozycji | [[ data.swapShort ]] punkty |
| Minimalny spread | [[ data.stats.minSpread ]] |
| Średni spread | [[ data.stats.avgSpread ]] |
| Minimalny rozmiar kontraktu | [[ data.minVolume ]] |
| Minimalny krok | [[ data.stepVolume ]] |
| Prowizja i swap | Prowizja i swap |
| Dźwignia | Dźwignia |
| Godziny handlu | Godziny handlu |
* The spreads provided are a reflection of the time-weighted average. Though TradingMoon attempts to provide competitive spreads during all trading hours, clients should note that these may vary and are susceptible to underlying market conditions. The above is provided for indicative purposes only. Clients are advised to check important news announcements on our Economic Calendar, which may result in the widening of spreads, amongst other instances.
The above spreads are applicable under normal trading conditions. TradingMoon has the right to amend the above spreads according to market conditions as per the 'Terms and Conditions'.
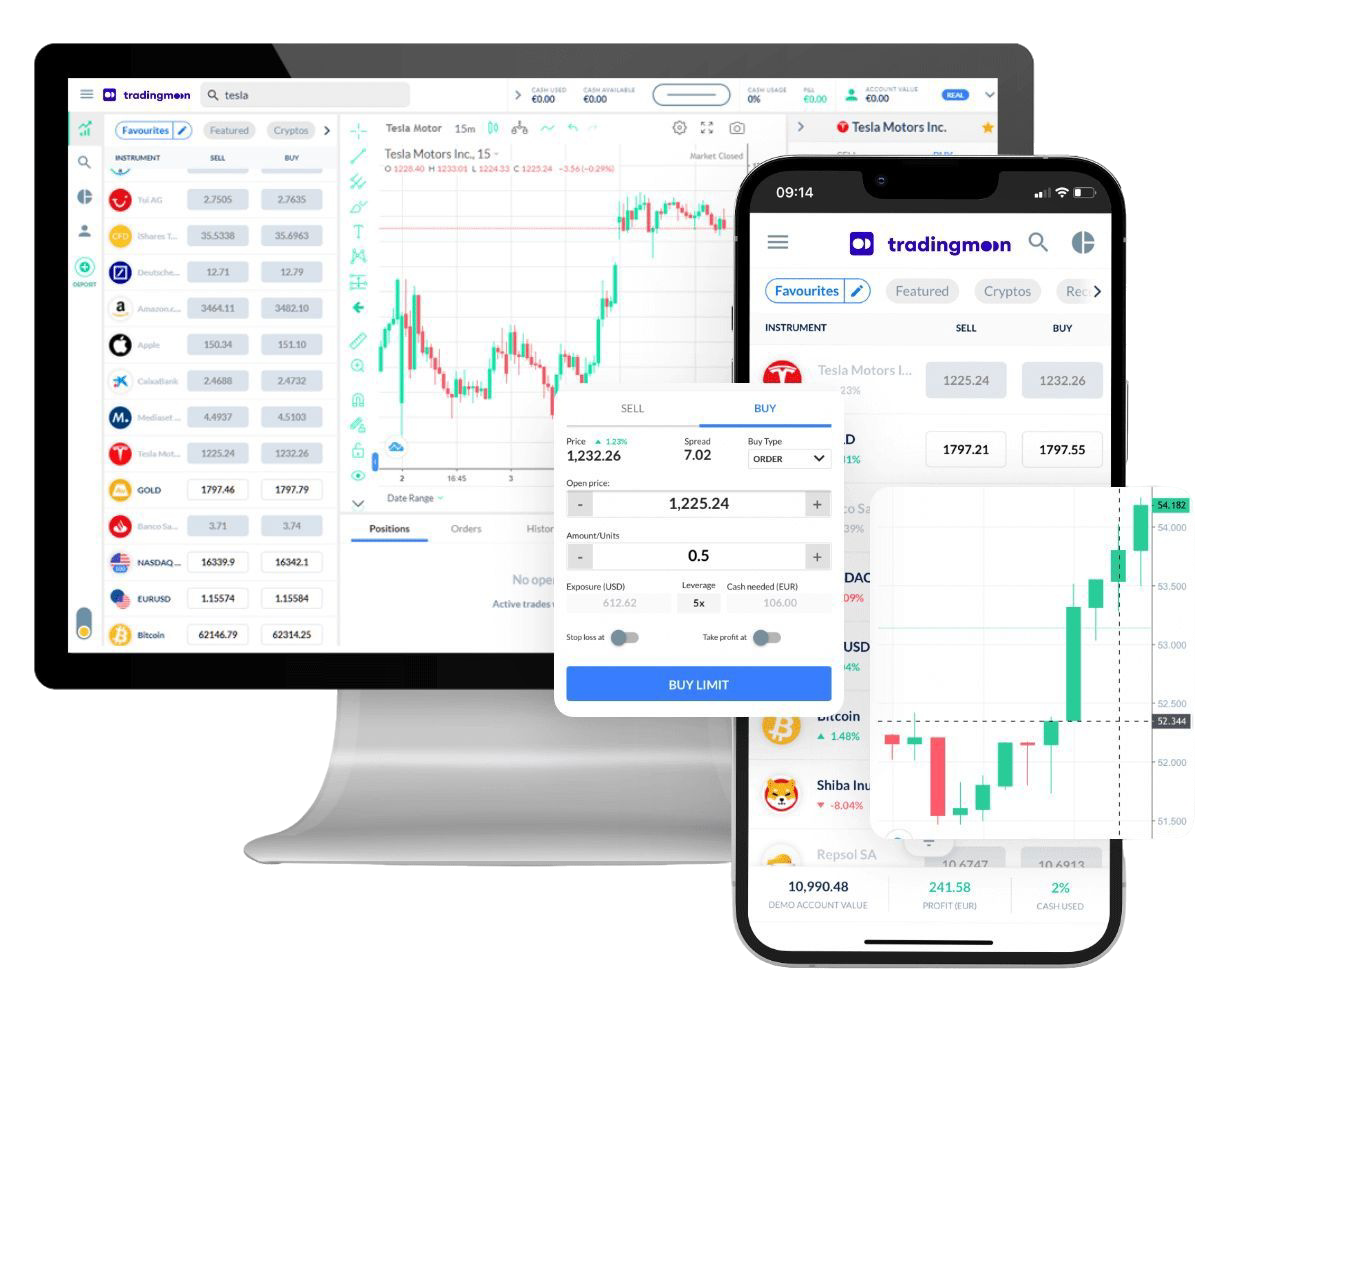
Handluj [[data.name]] z TradingMoon
Wszystko bezproblemowo z elastycznymi rozmiarami transakcji i z zerową prowizją!*
- Handluj 24/5
- Minimalne wymagania dotyczące depozytu zabezpieczającego
- Bez prowizji, tylko spread
- Dostępne udziały ułamkowe
- Łatwa w użyciu platforma
*Mogą obowiązywać inne opłaty.
Dlaczego warto handlować [[data.name]]
Wykorzystaj w pełni fluktuacje cen – bez względu na kierunek, w którym cena się zmienia i bez ograniczeń kapitałowych, które wiążą się z zakupem aktywów bazowych.
CFD
Akcje

Zarabiaj na rosnących cenach (zajmij pozycję długą)


Wykorzystaj spadające ceny (zajmij pozycję krótką)

Handluj z dźwignią
Zajmuj większe pozycje niż gotówka, którą masz do dyspozycji

Handluj na zmienności
Nie musisz być właścicielem aktywu

Brak prowizji
Tylko niskie spready

Zarządzaj ryzykiem za pomocą narzędzi na platformie
Możliwość ustawienia poziomów take profit i stop loss