


[[ data.name ]]
[[ data.ticker ]]
[[ data.price ]] [[ data.change ]] ([[ data.changePercent ]]%)
Niski: [[ data.low ]]
Wysoki: [[ data.high ]]
O
Historia
Różnice między inwestowaniem a handlem
O
Historia
Różnice między inwestowaniem a handlem
Alfa SA B A, stock symbol: (ALFAA.MX) is a Mexican conglomerate with a market capitalization of 49.01 billion MXN as of August 4, 2023. Founded in 1974, it operates across various industries, including petrochemicals, automotive, food, and telecommunications.
It was founded by Roberto Garza Sada, Eugenio Garza Lagüera, and other prominent Mexican businessmen. Over the years, the company has expanded through strategic acquisitions and organic growth, becoming a leading player in Mexico's industrial sector.
The conglomerate's subsidiaries include Alpek (petrochemicals), Nemak (automotive parts), Sigma Alimentos (food), and Axtel (telecommunications). Alfa S.A.B. de C.V. is publicly listed on the Mexican Stock Exchange (Bolsa Mexicana de Valores), providing investors and traders with an opportunity to be part of its diversified portfolio and continued growth.
Alfa started trading on the Mexican Stock Exchange (Bolsa Mexicana de Valores) in 2010, at a price of around 8 MXN. The stock price went through several ups and downs during the last five years, with the highest stock price reached being 25.520 MXN in September 2018, and the lowest stock price reached being 6.120 MXN in April 2020.
To analyze the stock, traders may use several trading strategies, such as technical analysis. Technical analysis may help traders identify trends and patterns by using various indicators, such as moving averages or relative strength index (RSI). For example, when the stock price is above its 200-day moving average, it could indicate a bullish trend, while a stock price below its 200-day moving average may indicate a bearish trend. However, trading strategies should be used with caution, as past performance is not always indicative of future results.
If you're planning to trade Alfa stock, you should consider looking into the company's competitors. It's always a good idea to have an understanding of the market and the other players in the industry before investing. They include:
- Fomento Economico Mexicano, S.A.B. de C.V. (FEMSAUBD.MX) is a Mexican multinational company with interests in beverage, retail, and fuel industries. FEMSA operates OXXO convenience stores and is a major shareholder in Coca-Cola FEMSA, one of the world's largest Coca-Cola bottlers. It also operates a fuel station chain called OXXO Gas.
- America Movil (AMX.US) is a Mexican telecommunications company and one of the largest mobile network operators in Latin America. It offers mobile and fixed-line telecommunication services, including voice, data, and internet solutions, serving millions of customers across the region.
| Swap dla długiej pozycji | [[ data.swapLong ]] punkty |
|---|---|
| Swap dla krótkiej pozycji | [[ data.swapShort ]] punkty |
| Minimalny spread | [[ data.stats.minSpread ]] |
| Średni spread | [[ data.stats.avgSpread ]] |
| Minimalny rozmiar kontraktu | [[ data.minVolume ]] |
| Minimalny krok | [[ data.stepVolume ]] |
| Prowizja i swap | Prowizja i swap |
| Dźwignia | Dźwignia |
| Godziny handlu | Godziny handlu |
* The spreads provided are a reflection of the time-weighted average. Though TradingMoon attempts to provide competitive spreads during all trading hours, clients should note that these may vary and are susceptible to underlying market conditions. The above is provided for indicative purposes only. Clients are advised to check important news announcements on our Economic Calendar, which may result in the widening of spreads, amongst other instances.
The above spreads are applicable under normal trading conditions. TradingMoon has the right to amend the above spreads according to market conditions as per the 'Terms and Conditions'.
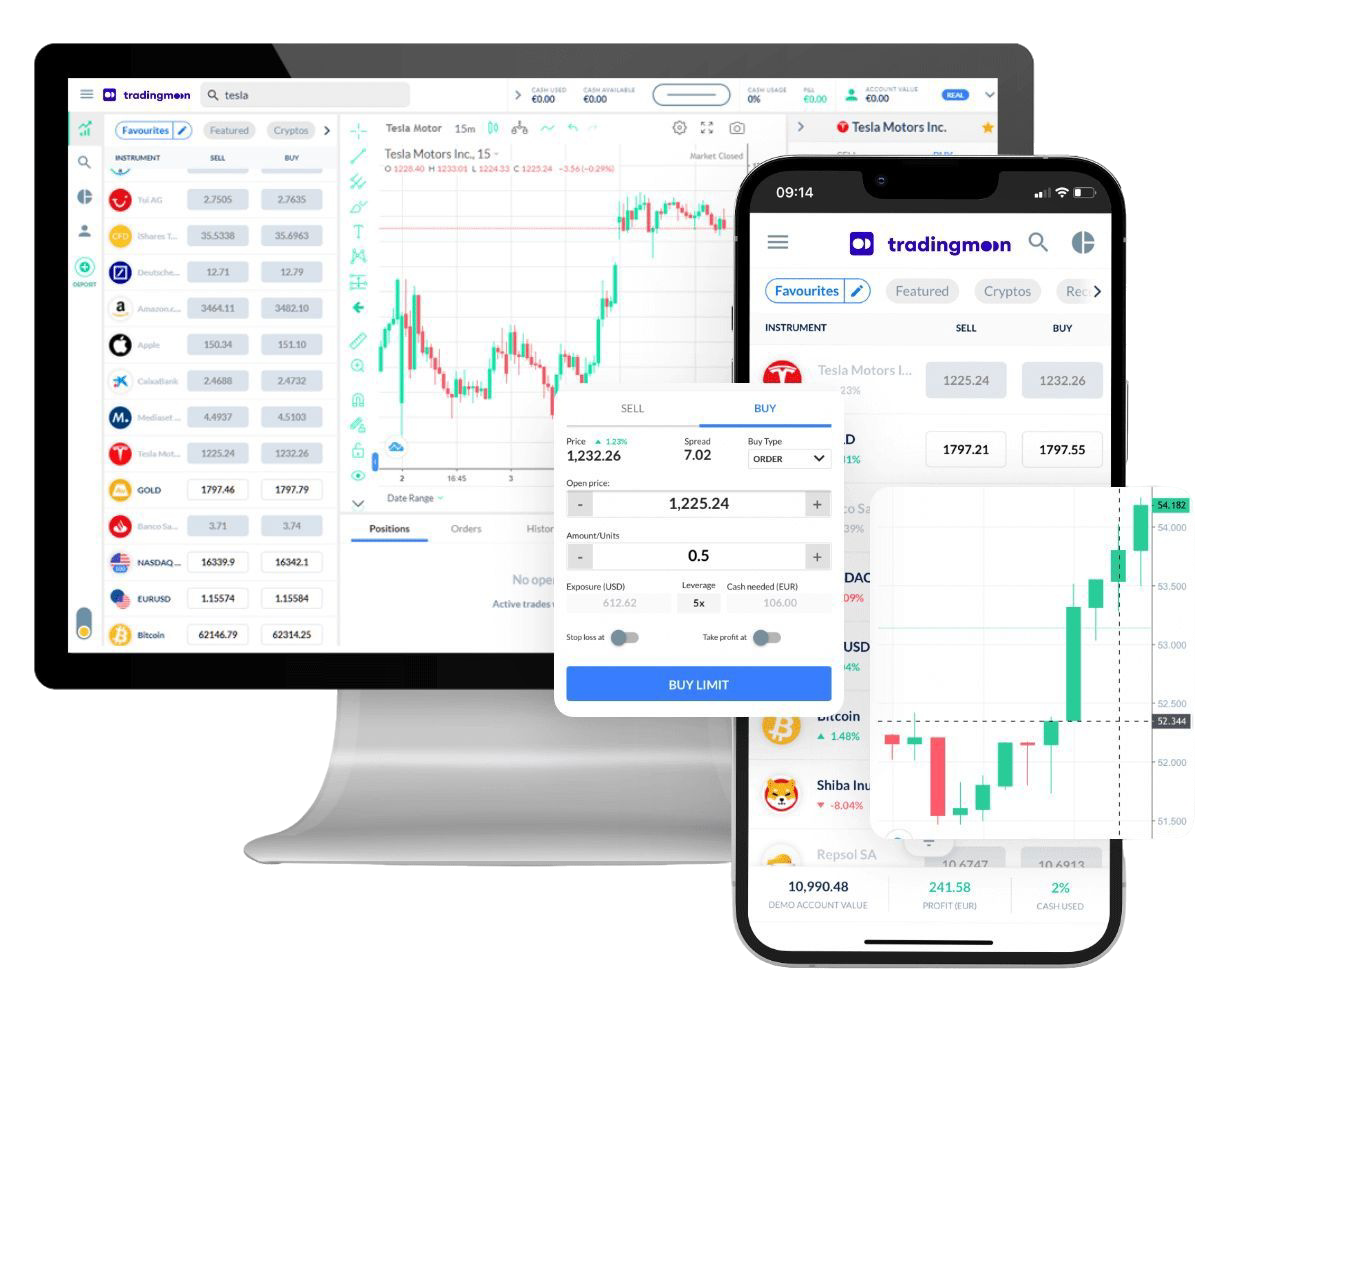
Handluj [[data.name]] z TradingMoon
Wszystko bezproblemowo z elastycznymi rozmiarami transakcji i z zerową prowizją!*
- Handluj 24/5
- Minimalne wymagania dotyczące depozytu zabezpieczającego
- Bez prowizji, tylko spread
- Dostępne udziały ułamkowe
- Łatwa w użyciu platforma
*Mogą obowiązywać inne opłaty.
Dlaczego warto handlować [[data.name]]
Wykorzystaj w pełni fluktuacje cen – bez względu na kierunek, w którym cena się zmienia i bez ograniczeń kapitałowych, które wiążą się z zakupem aktywów bazowych.
CFD
Akcje

Zarabiaj na rosnących cenach (zajmij pozycję długą)


Wykorzystaj spadające ceny (zajmij pozycję krótką)

Handluj z dźwignią
Zajmuj większe pozycje niż gotówka, którą masz do dyspozycji

Handluj na zmienności
Nie musisz być właścicielem aktywu

Brak prowizji
Tylko niskie spready

Zarządzaj ryzykiem za pomocą narzędzi na platformie
Możliwość ustawienia poziomów take profit i stop loss