


[[ data.name ]]
[[ data.ticker ]]
[[ data.price ]] [[ data.change ]] ([[ data.changePercent ]]%)
Niski: [[ data.low ]]
Wysoki: [[ data.high ]]
O
Historia
Różnice między inwestowaniem a handlem
O
Historia
Różnice między inwestowaniem a handlem
Engie (ENGIE.PA) is a major French multinational utility company with a market capitalization of €37.09 billion as of July 25, 2023. Founded in 1822 as the Société Générale pour l'Industrie, it has a long and storied history. Originally focused on gas distribution, the company expanded over the years to encompass electricity generation, renewable energy, and various energy-related services.
In 2008, the company was rebranded as Engie, reflecting its commitment to sustainable energy solutions. It has since emerged as a global leader in the transition to low-carbon energy, emphasizing renewables and green technologies. The company went public in 2005, trading on the Euronext Paris stock exchange. It continues to play a crucial role in shaping the future of energy by promoting eco-friendly practices and innovations.
Let’s start by taking a look at the highest and lowest stock price points for Engie over the past five years. The highest stock price reached was €16.80 in February 2020, while the lowest stock price reached was €8.63 in April 2020. This substantial drop in price may have been due to external factors, such as the COVID-19 pandemic, which caused global stock markets to plummet.
When analysing this stock, traders may consider using various tools and indicators to make informed decisions. For example, they may use technical indicators such as moving averages to identify trends or patterns in the stock price. They could also use fundamental analysis to evaluate the company's financial reports and industry trends.
One trading strategy that traders could utilise when analysing Engie’s stock price is "swing trading" strategy, which involves holding a stock for a short period (usually a few days to a few weeks) and profiting from small price movements.
Investors and traders face many challenges when it comes to selecting the right stocks to invest in. One important factor is to compare and analyze the company's competitors to gain insight in a particular industry before making decisions. They include:
- E.ON SE (EOAN.DE): E.ON SE is a German-based power and gas company and a tough competitor in Europe. It offers renewable energy, energy efficiency and various other services.
- RWE AG (RWE.DE): Founded in 1898, RWE is a German energy company that specializes in power generation, trading, and transmission. The company operates through various subsidiaries and divisions, including RWE Renewables and RWE Supply & Trading.
Conducting in-depth research and analyzing market trends of the competitors may help you make informed investment decisions.
| Swap dla długiej pozycji | [[ data.swapLong ]] punkty |
|---|---|
| Swap dla krótkiej pozycji | [[ data.swapShort ]] punkty |
| Minimalny spread | [[ data.stats.minSpread ]] |
| Średni spread | [[ data.stats.avgSpread ]] |
| Minimalny rozmiar kontraktu | [[ data.minVolume ]] |
| Minimalny krok | [[ data.stepVolume ]] |
| Prowizja i swap | Prowizja i swap |
| Dźwignia | Dźwignia |
| Godziny handlu | Godziny handlu |
* The spreads provided are a reflection of the time-weighted average. Though TradingMoon attempts to provide competitive spreads during all trading hours, clients should note that these may vary and are susceptible to underlying market conditions. The above is provided for indicative purposes only. Clients are advised to check important news announcements on our Economic Calendar, which may result in the widening of spreads, amongst other instances.
The above spreads are applicable under normal trading conditions. TradingMoon has the right to amend the above spreads according to market conditions as per the 'Terms and Conditions'.
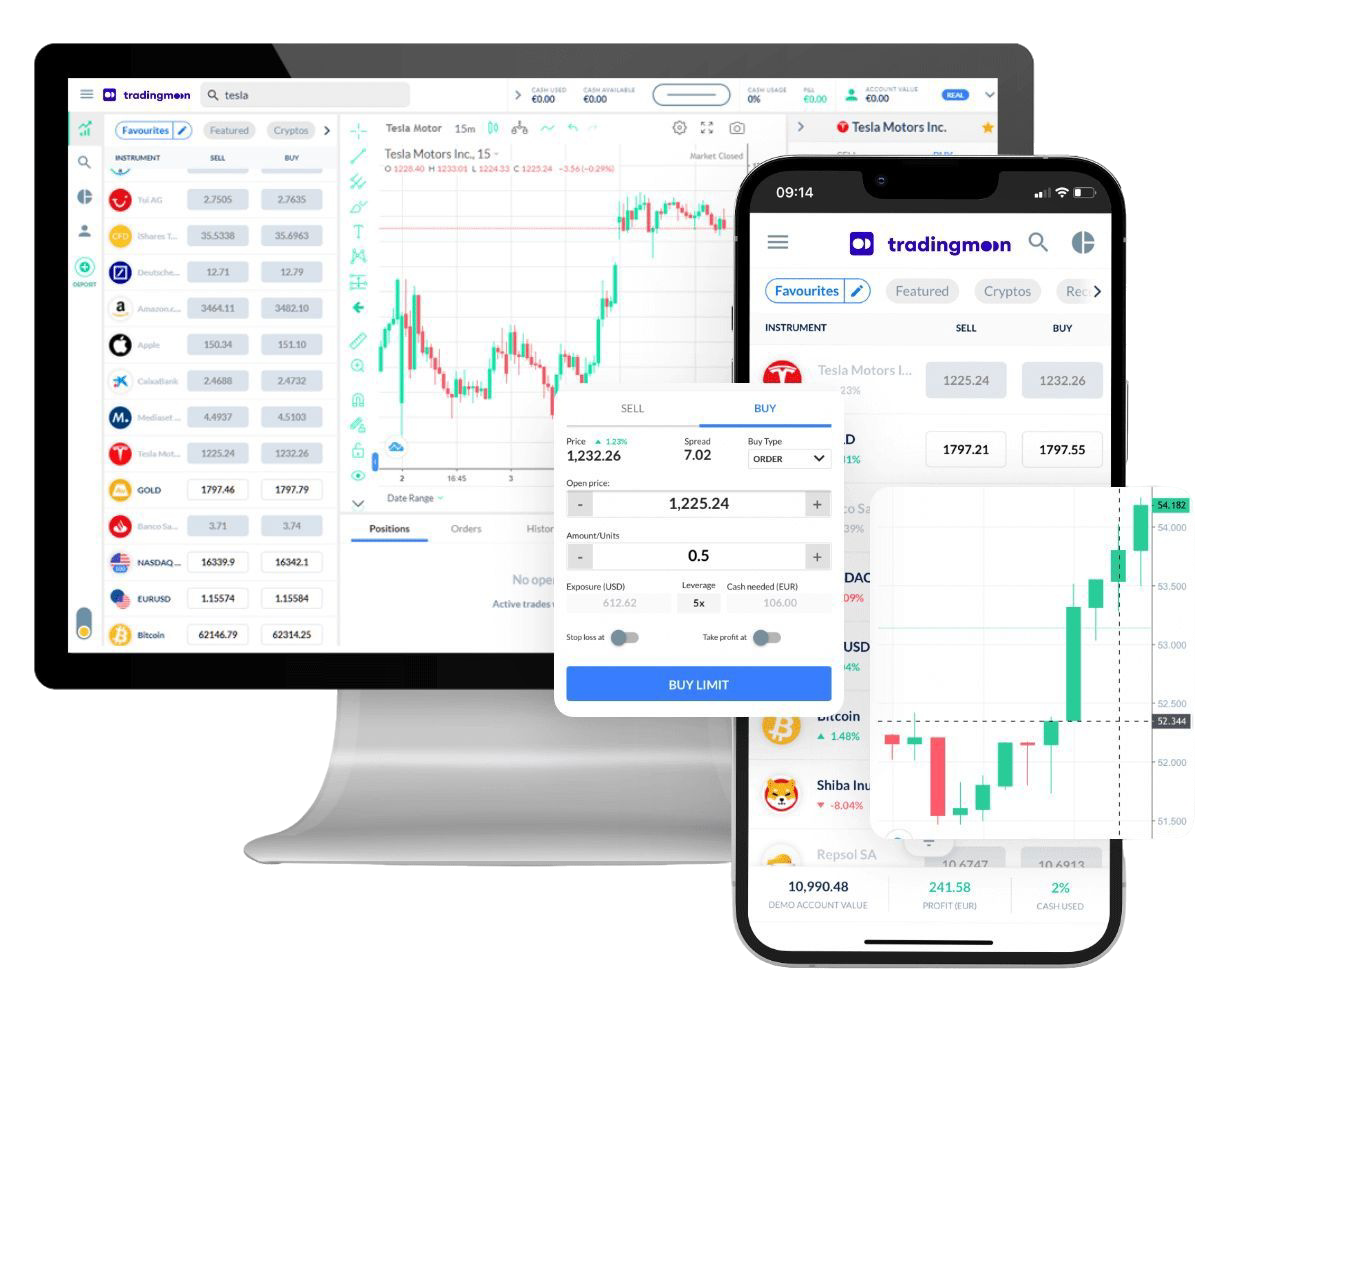
Handluj [[data.name]] z TradingMoon
Wszystko bezproblemowo z elastycznymi rozmiarami transakcji i z zerową prowizją!*
- Handluj 24/5
- Minimalne wymagania dotyczące depozytu zabezpieczającego
- Bez prowizji, tylko spread
- Dostępne udziały ułamkowe
- Łatwa w użyciu platforma
*Mogą obowiązywać inne opłaty.
Dlaczego warto handlować [[data.name]]
Wykorzystaj w pełni fluktuacje cen – bez względu na kierunek, w którym cena się zmienia i bez ograniczeń kapitałowych, które wiążą się z zakupem aktywów bazowych.
CFD
Akcje

Zarabiaj na rosnących cenach (zajmij pozycję długą)


Wykorzystaj spadające ceny (zajmij pozycję krótką)

Handluj z dźwignią
Zajmuj większe pozycje niż gotówka, którą masz do dyspozycji

Handluj na zmienności
Nie musisz być właścicielem aktywu

Brak prowizji
Tylko niskie spready

Zarządzaj ryzykiem za pomocą narzędzi na platformie
Możliwość ustawienia poziomów take profit i stop loss