


[[ data.name ]]
[[ data.ticker ]]
[[ data.price ]] [[ data.change ]] ([[ data.changePercent ]]%)
Niski: [[ data.low ]]
Wysoki: [[ data.high ]]
O
Historia
Różnice między inwestowaniem a handlem
O
Historia
Różnice między inwestowaniem a handlem
Honeywell (HON) is an American multinational conglomerate with a market capitalization of $125.83 billion as of August 15, 2023. Founded in 1906 by Mark C. Honeywell, the company has evolved into a leading industrial technology provider. It offers a diverse range of solutions in aerospace, building technologies, and performance materials.
The company's history is marked by innovation, including pioneering thermostat technology. Over the years, Honeywell expanded into various industries through acquisitions, becoming a global player in aerospace, automation, and safety solutions. It went public in 1927.
With a commitment to technological advancement and industrial progress, the company remains a key contributor to sectors that require cutting-edge solutions for efficiency, safety, and sustainability.
Over the past five years, Honeywell stock's price has varied between a low of $101.08 and a high of $236.86. In March 2020, the COVID-19 pandemic triggered a sharp decline in Honeywell's stock price, plummeting to the lowest price of $101.08. However, the stock quickly rebounded, and in August 2021, Honeywell reached its highest price ever at $236.86.
Traders may use various trading strategies to analyse the stock. They include day trading, copy trading, swing trading and position trading. In addition, traders may use various trading tools and indicators to analyse the stock. One example is the bulls and bears power indicator, which shows the buying and selling pressure in the market. Another tool is Elliott Waves, which is a technical analysis technique that uses wave patterns to identify market trends. Another indicator is the Awesome Oscillator which measures the momentum of the market, indicating when the stock is overbought or oversold.
When it comes to trading stocks, it's important to thoroughly research the field before making any moves, and that includes competitors. So who are Honeywell's competitors?
- General Electric (GE.US) is a multinational conglomerate founded in 1892. It's a diversified industrial and technology company known for its involvement in aviation, power, healthcare, and more. GE has a rich history of innovation, including the creation of the first electric toaster and jet engine.
- United Technologies (UTX.US) was a multinational conglomerate until its merger with Raytheon in 2020. It encompassed brands like Pratt & Whitney and Carrier. The company was known for aerospace systems, elevators, and building technologies.
- Siemens (SIE.DE) is a German multinational conglomerate founded in 1847. It operates in various industries, including energy, healthcare, and industrial automation. Siemens is renowned for its advancements in technology, from electrical engineering to automation systems.
| Swap dla długiej pozycji | [[ data.swapLong ]] punkty |
|---|---|
| Swap dla krótkiej pozycji | [[ data.swapShort ]] punkty |
| Minimalny spread | [[ data.stats.minSpread ]] |
| Średni spread | [[ data.stats.avgSpread ]] |
| Minimalny rozmiar kontraktu | [[ data.minVolume ]] |
| Minimalny krok | [[ data.stepVolume ]] |
| Prowizja i swap | Prowizja i swap |
| Dźwignia | Dźwignia |
| Godziny handlu | Godziny handlu |
* The spreads provided are a reflection of the time-weighted average. Though TradingMoon attempts to provide competitive spreads during all trading hours, clients should note that these may vary and are susceptible to underlying market conditions. The above is provided for indicative purposes only. Clients are advised to check important news announcements on our Economic Calendar, which may result in the widening of spreads, amongst other instances.
The above spreads are applicable under normal trading conditions. TradingMoon has the right to amend the above spreads according to market conditions as per the 'Terms and Conditions'.
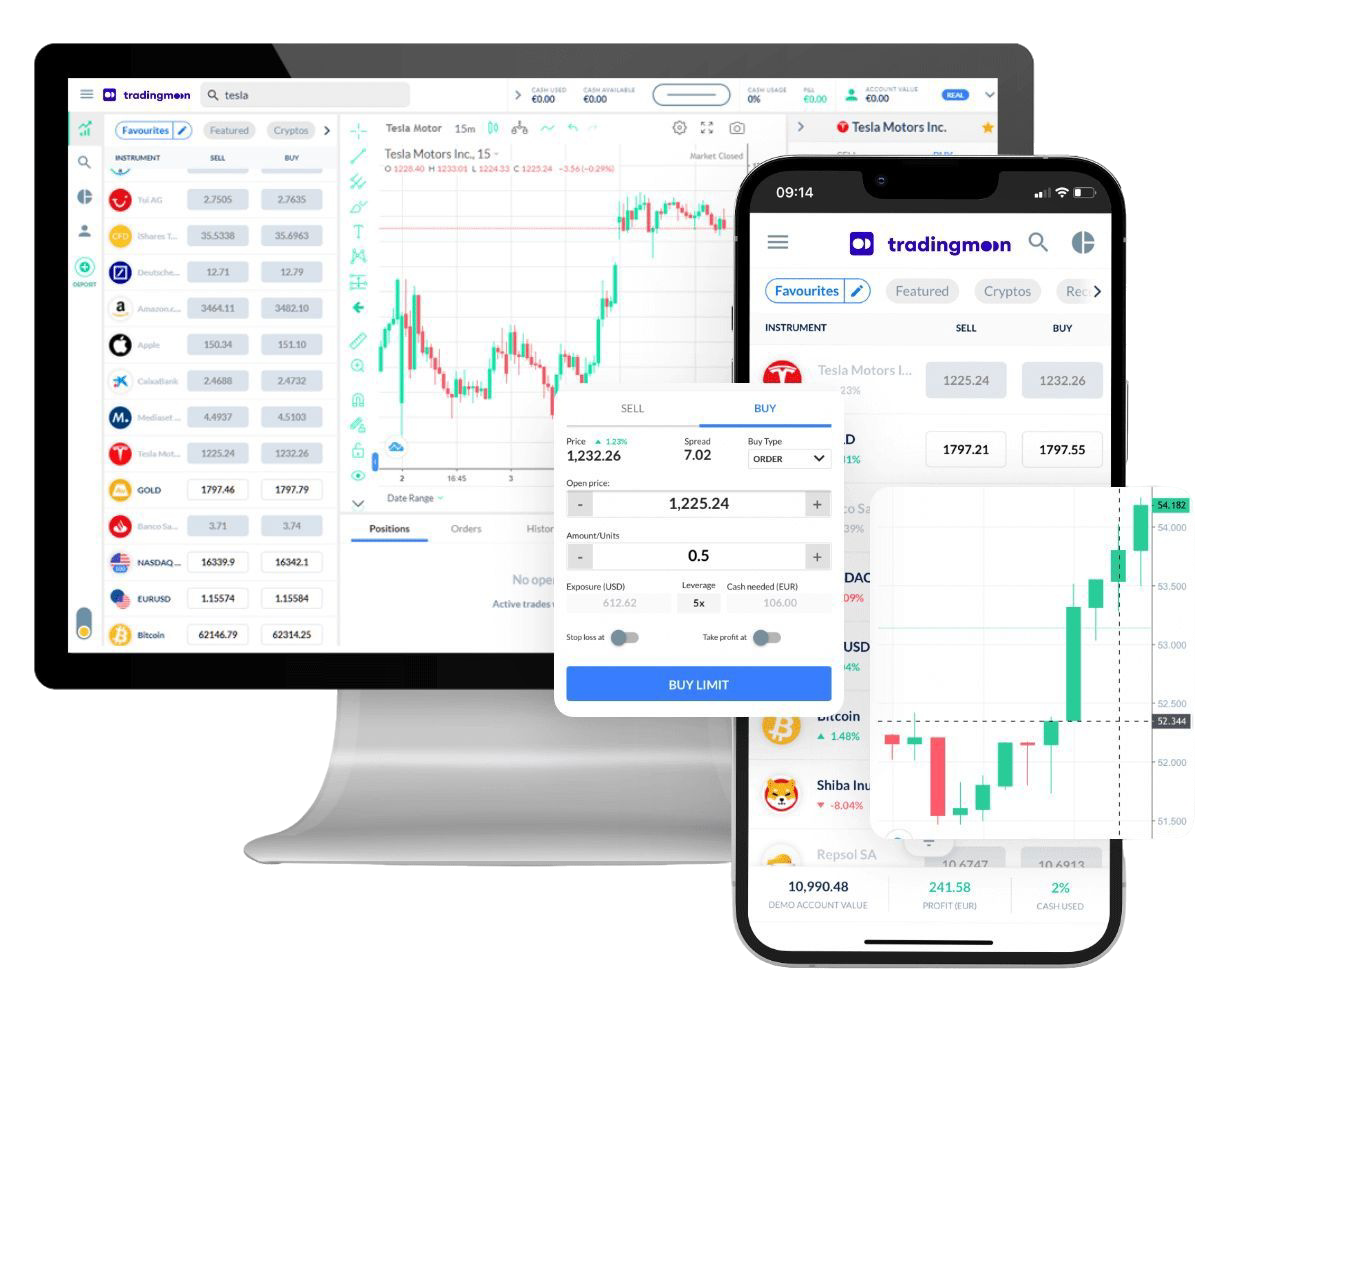
Handluj [[data.name]] z TradingMoon
Wszystko bezproblemowo z elastycznymi rozmiarami transakcji i z zerową prowizją!*
- Handluj 24/5
- Minimalne wymagania dotyczące depozytu zabezpieczającego
- Bez prowizji, tylko spread
- Dostępne udziały ułamkowe
- Łatwa w użyciu platforma
*Mogą obowiązywać inne opłaty.
Dlaczego warto handlować [[data.name]]
Wykorzystaj w pełni fluktuacje cen – bez względu na kierunek, w którym cena się zmienia i bez ograniczeń kapitałowych, które wiążą się z zakupem aktywów bazowych.
CFD
Akcje

Zarabiaj na rosnących cenach (zajmij pozycję długą)


Wykorzystaj spadające ceny (zajmij pozycję krótką)

Handluj z dźwignią
Zajmuj większe pozycje niż gotówka, którą masz do dyspozycji

Handluj na zmienności
Nie musisz być właścicielem aktywu

Brak prowizji
Tylko niskie spready

Zarządzaj ryzykiem za pomocą narzędzi na platformie
Możliwość ustawienia poziomów take profit i stop loss