


[[ data.name ]]
[[ data.ticker ]]
[[ data.price ]] [[ data.change ]] ([[ data.changePercent ]]%)
Niski: [[ data.low ]]
Wysoki: [[ data.high ]]
O
Historia
Różnice między inwestowaniem a handlem
O
Historia
Różnice między inwestowaniem a handlem
Manchester United (MANU.US) is a renowned English professional football club, listed on the New York Stock Exchange, with a market capitalization of $3.59 billion as of July 28, 2023. The club's rich history can be traced back to 1878 when it was founded as Newton Heath LYR Football Club.
In 1902, the club was renamed Manchester United, and it has since become one of the most successful and iconic football clubs in the world. With an illustrious legacy, it has won numerous domestic and international titles, including multiple English Premier League championships and UEFA Champions League titles. The club's distinctive red jersey and passionate fan base have solidified its global reputation. The club went public in 2012, allowing fans and investors to have ownership in one of football's most storied clubs.
Manchester United's share price has had its ups and downs in the past five years. The highest stock price reached was $27.70 in August 2018, while the lowest was $10.41 in July 2022. In June 2018, the stock price surged to its then-highest point in reaction to rumours of a possible takeover bid. The share price rose by 10% in one day, and this news led to a surge in trading volumes as investors tried to capitalise on potential gains. However, no official takeover bid was made, and the stock price gradually declined over the next few months.
Traders may use various tools and indicators to analyse the Manchester United stock price. One popular tool is moving averages, which may help to identify trend direction and support/resistance levels. For example, if the 50-day moving average crosses above the 200-day moving average, this is known as a "golden cross" and could signal a bullish trend.
Manchester United (MANU.US) is one of the most popular stocks in the market and it is not surprising that traders and investors alike are interested in trading this stock. However, before you start trading its stock, it is essential to know who they are competing against in the market:
- FC Barcelona (BARUSD) is a prestigious Spanish professional football club based in Barcelona. It is one of the most successful football clubs globally, having won numerous domestic and international titles, including multiple La Liga and UEFA Champions League trophies.
- Atletico Madrid (ATMUSD) is another prominent Spanish football club based in Madrid. Founded in 1903, it has also enjoyed significant success, winning several La Liga titles and domestic cups. Atletico Madrid is renowned for its defensive prowess and intense, hardworking style of play.
| Swap dla długiej pozycji | [[ data.swapLong ]] punkty |
|---|---|
| Swap dla krótkiej pozycji | [[ data.swapShort ]] punkty |
| Minimalny spread | [[ data.stats.minSpread ]] |
| Średni spread | [[ data.stats.avgSpread ]] |
| Minimalny rozmiar kontraktu | [[ data.minVolume ]] |
| Minimalny krok | [[ data.stepVolume ]] |
| Prowizja i swap | Prowizja i swap |
| Dźwignia | Dźwignia |
| Godziny handlu | Godziny handlu |
* The spreads provided are a reflection of the time-weighted average. Though TradingMoon attempts to provide competitive spreads during all trading hours, clients should note that these may vary and are susceptible to underlying market conditions. The above is provided for indicative purposes only. Clients are advised to check important news announcements on our Economic Calendar, which may result in the widening of spreads, amongst other instances.
The above spreads are applicable under normal trading conditions. TradingMoon has the right to amend the above spreads according to market conditions as per the 'Terms and Conditions'.
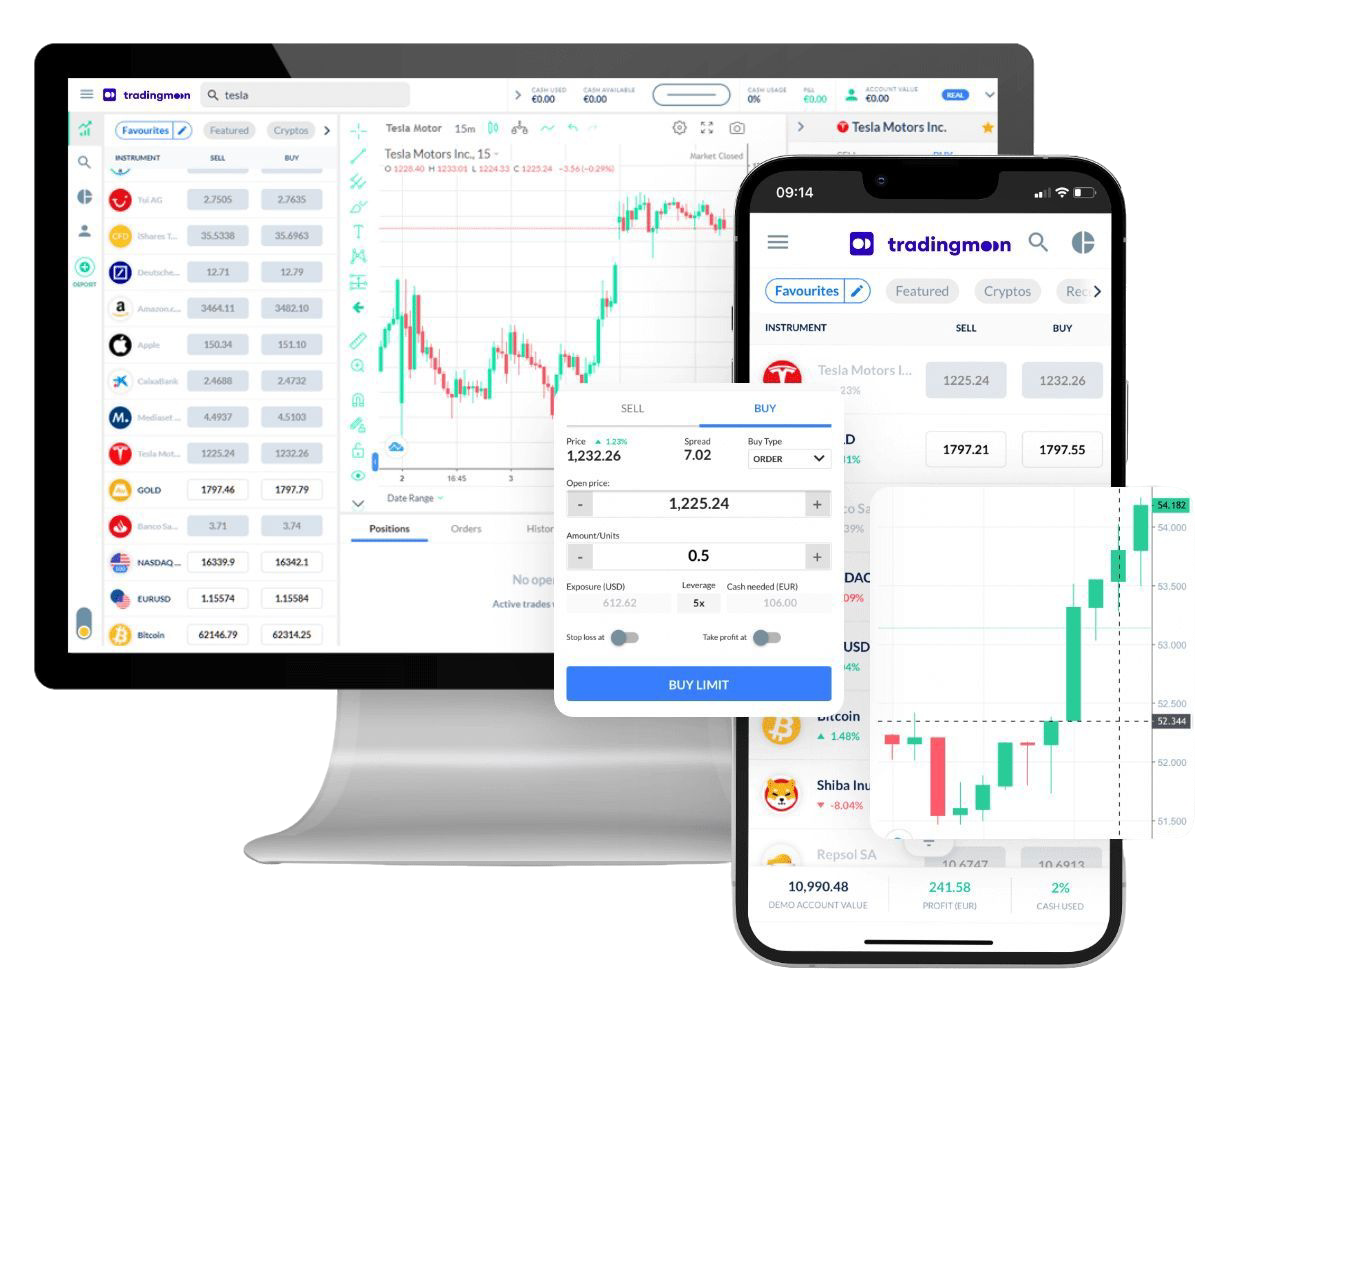
Handluj [[data.name]] z TradingMoon
Wszystko bezproblemowo z elastycznymi rozmiarami transakcji i z zerową prowizją!*
- Handluj 24/5
- Minimalne wymagania dotyczące depozytu zabezpieczającego
- Bez prowizji, tylko spread
- Dostępne udziały ułamkowe
- Łatwa w użyciu platforma
*Mogą obowiązywać inne opłaty.
Dlaczego warto handlować [[data.name]]
Wykorzystaj w pełni fluktuacje cen – bez względu na kierunek, w którym cena się zmienia i bez ograniczeń kapitałowych, które wiążą się z zakupem aktywów bazowych.
CFD
Akcje

Zarabiaj na rosnących cenach (zajmij pozycję długą)


Wykorzystaj spadające ceny (zajmij pozycję krótką)

Handluj z dźwignią
Zajmuj większe pozycje niż gotówka, którą masz do dyspozycji

Handluj na zmienności
Nie musisz być właścicielem aktywu

Brak prowizji
Tylko niskie spready

Zarządzaj ryzykiem za pomocą narzędzi na platformie
Możliwość ustawienia poziomów take profit i stop loss