


[[ data.name ]]
[[ data.ticker ]]
[[ data.price ]] [[ data.change ]] ([[ data.changePercent ]]%)
Niski: [[ data.low ]]
Wysoki: [[ data.high ]]
O
Historia
Różnice między inwestowaniem a handlem
O
Historia
Różnice między inwestowaniem a handlem
McDonald's (MCD.US) is a global fast-food chain with a current market cap of $210.67 billion as of June 14th, 2023. Established in 1940 by Richard and Maurice McDonald, the company revolutionized the fast-food industry with its efficient assembly-line system and iconic golden arches. It went public in 1965, expanding rapidly both domestically and internationally. It offers a diverse menu of hamburgers, chicken, fries, and other popular food items.
Known for its consistency, affordability, and convenience, the company has become one of the world's largest fast-food chains, serving millions of customers daily across its thousands of locations worldwide. The company continues to innovate, adapting to changing consumer preferences with healthier menu options and digital advancements in ordering and delivery services.
McDonald's stock has displayed a notable price history over the past five years, influenced by various market factors and company performance. During the past five years, MCD.US stock reached its highest point at $298.86 per share in May 2023, reflecting moments of market optimism and positive developments. These highs might have been driven by factors such as strong financial performance, successful product launches, or strategic expansions. Conversely, the stock also experienced its lowest price at $124.23 per share in March 2020. These lows may have been influenced by factors such as economic downturns, industry challenges, or company-specific issues.
McDonald's stock price history highlights the volatility inherent in the stock market. It is important for investors to conduct thorough analysis, considering factors such as the company's financial performance, industry trends, and consumer preferences when evaluating this stock. It is advisable to stay informed and make informed decisions based on the current market situation and individual investment goals.
Before trading McDonald's stock, it is crucial to consider the competitive landscape within the fast-food industry. McDonald's faces competition from various players, both global and regional, in the quick-service restaurant sector.
Key competitors include Starbucks (SBUX.US) and Yum! Brands (YUM.US) - which owns KFC, Pizza Hut, and Taco Bell. These companies vie for market share, customer loyalty, and innovation in menu offerings. Factors to evaluate when comparing McDonald's with its competitors include brand strength, store footprint, customer satisfaction, pricing strategies, and technological advancements. Understanding the competitive dynamics and staying updated on industry trends may provide valuable insights for assessing this stock. Also, thorough analysis of the competitive landscape is crucial for making informed decisions when trading this stock.
| Swap dla długiej pozycji | [[ data.swapLong ]] punkty |
|---|---|
| Swap dla krótkiej pozycji | [[ data.swapShort ]] punkty |
| Minimalny spread | [[ data.stats.minSpread ]] |
| Średni spread | [[ data.stats.avgSpread ]] |
| Minimalny rozmiar kontraktu | [[ data.minVolume ]] |
| Minimalny krok | [[ data.stepVolume ]] |
| Prowizja i swap | Prowizja i swap |
| Dźwignia | Dźwignia |
| Godziny handlu | Godziny handlu |
* The spreads provided are a reflection of the time-weighted average. Though TradingMoon attempts to provide competitive spreads during all trading hours, clients should note that these may vary and are susceptible to underlying market conditions. The above is provided for indicative purposes only. Clients are advised to check important news announcements on our Economic Calendar, which may result in the widening of spreads, amongst other instances.
The above spreads are applicable under normal trading conditions. TradingMoon has the right to amend the above spreads according to market conditions as per the 'Terms and Conditions'.
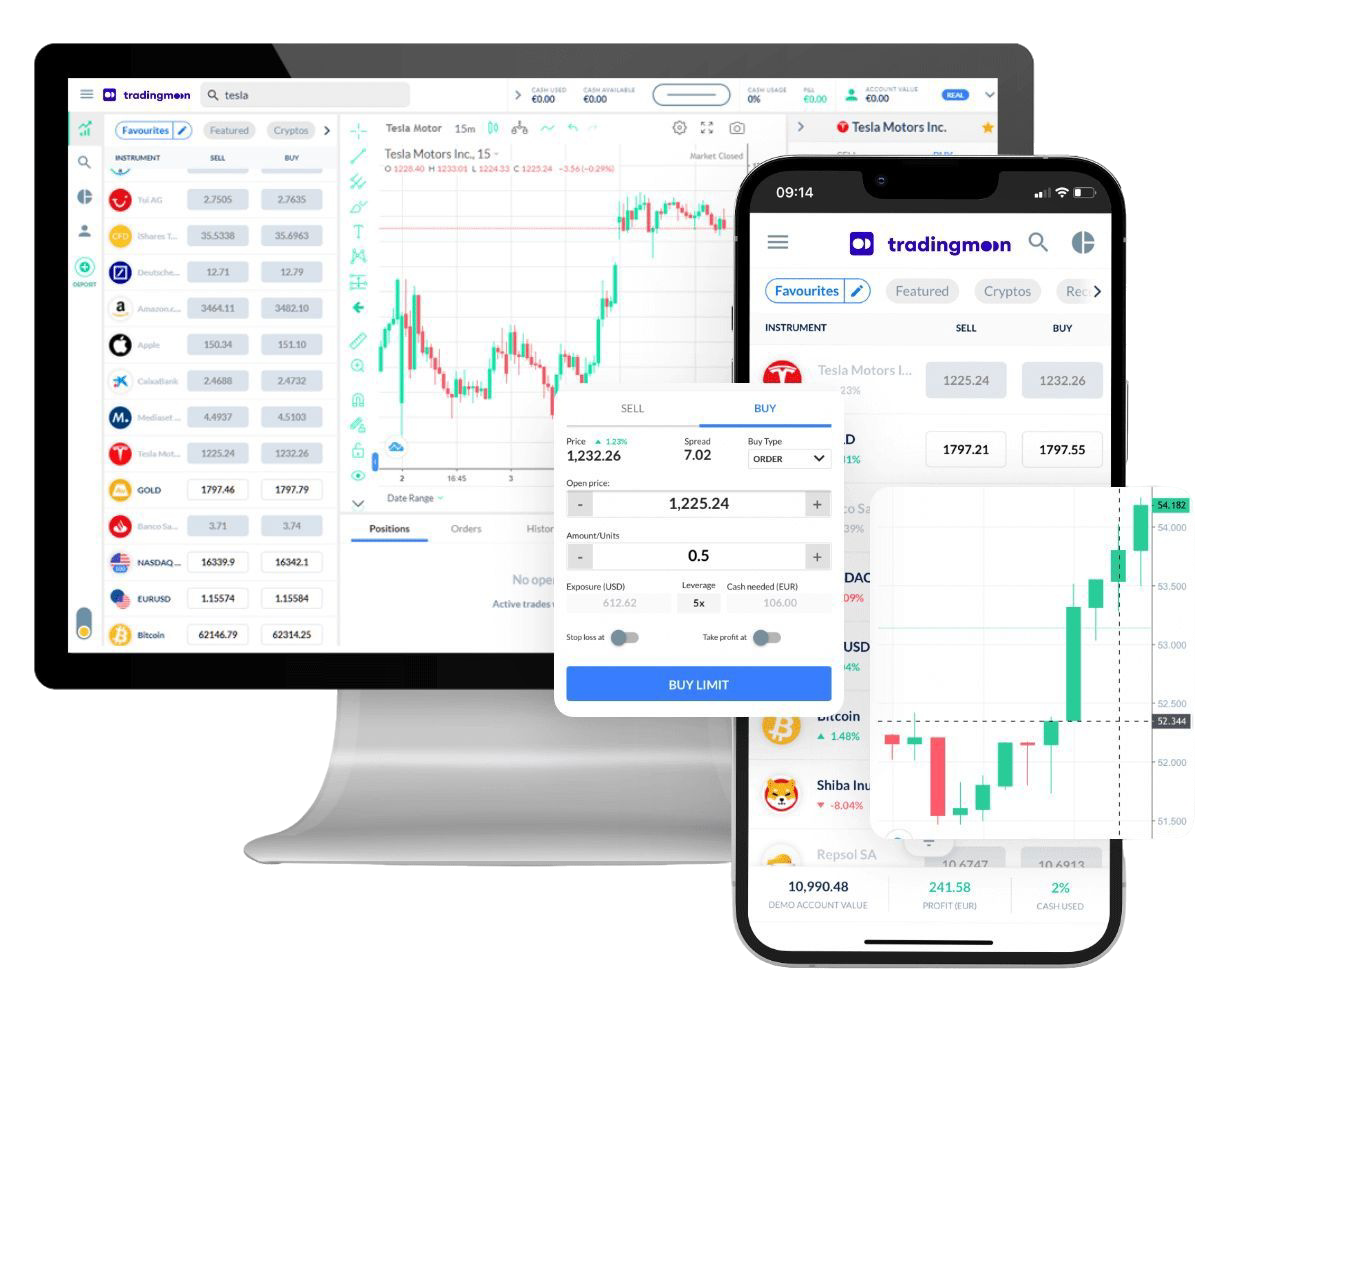
Handluj [[data.name]] z TradingMoon
Wszystko bezproblemowo z elastycznymi rozmiarami transakcji i z zerową prowizją!*
- Handluj 24/5
- Minimalne wymagania dotyczące depozytu zabezpieczającego
- Bez prowizji, tylko spread
- Dostępne udziały ułamkowe
- Łatwa w użyciu platforma
*Mogą obowiązywać inne opłaty.
Dlaczego warto handlować [[data.name]]
Wykorzystaj w pełni fluktuacje cen – bez względu na kierunek, w którym cena się zmienia i bez ograniczeń kapitałowych, które wiążą się z zakupem aktywów bazowych.
CFD
Akcje

Zarabiaj na rosnących cenach (zajmij pozycję długą)


Wykorzystaj spadające ceny (zajmij pozycję krótką)

Handluj z dźwignią
Zajmuj większe pozycje niż gotówka, którą masz do dyspozycji

Handluj na zmienności
Nie musisz być właścicielem aktywu

Brak prowizji
Tylko niskie spready

Zarządzaj ryzykiem za pomocą narzędzi na platformie
Możliwość ustawienia poziomów take profit i stop loss