


[[ data.name ]]
[[ data.ticker ]]
[[ data.price ]] [[ data.change ]] ([[ data.changePercent ]]%)
Niski: [[ data.low ]]
Wysoki: [[ data.high ]]
O
Historia
Różnice między inwestowaniem a handlem
O
Historia
Różnice między inwestowaniem a handlem
Qualcomm Inc (QCOM.US) is a leading global semiconductor and telecommunications equipment company. It specializes in the design, development, and commercialization of advanced wireless technologies, including 5G, LTE, and IoT solutions. With a current market cap of $128.96 billion, it is a major player in the technology industry.
Founded in 1985 by Irwin M. Jacobs, Andrew Viterbi, and six others, Qualcomm has a rich history of innovation in wireless communications. It pioneered CDMA technology, which became a global standard for digital cellular communications. In 1991, it went public and has since experienced significant growth and success. The company has diversified its product portfolio, expanded into various markets, and established itself as a key player in the telecommunications industry. Today, Qualcomm continues to drive advancements in wireless technology, enabling connectivity and empowering industries worldwide.
Qualcomm's stock has shown both upward and downward trends, influenced by various factors such as market conditions, technological advancements, and company performance. Within the past five years, its highest stock price reached $193.58 per share in January 2022, possibly driven by strong financial performance, technological advancements, and positive market sentiment. In contrast, the lowest stock price hit $49.10 per share in January 2019, potentially due to market volatility or industry-specific challenges.
To analyze the company's share price history, traders can employ various tools and indicators. Techniques such as moving averages, Relative Strength Index (RSI), and Bollinger Bands may provide insights into the stock's performance and potential investment opportunities. Additionally, fundamental analysis, which includes examining financial statements, industry trends, and macroeconomic factors, may also provide a deeper understanding of the forces shaping the company's share price.
By combining technical and fundamental analysis, investors and traders may identify trends and potential opportunities within this dynamic market.
Before trading Qualcomm Inc (QCOM.US) stock, it's important to consider its competitors in the semiconductor industry. Some notable competitors worth considering include:
- Intel Corporation (INTC.US): A leading semiconductor company, known for its processors and other hardware components.
- NVIDIA Corporation (NVDA.US): Renowned for its advanced graphics processing units (GPUs) and artificial intelligence technologies.
- Texas Instruments Incorporated (TXN.US): A leading supplier of semiconductors for various industries, including automotive, industrial, and consumer elecatronics.
- Advanced Micro Devices, Inc. (AMD.US): Known for its processors and graphics cards, offering competitive alternatives to Intel and NVIDIA.
These competitors operate in the same industry as Qualcomm and may impact its market share, technological advancements, and overall performance. Monitoring their activities and understanding their strengths and weaknesses may provide valuable insights when considering trading this stock.
| Swap dla długiej pozycji | [[ data.swapLong ]] punkty |
|---|---|
| Swap dla krótkiej pozycji | [[ data.swapShort ]] punkty |
| Minimalny spread | [[ data.stats.minSpread ]] |
| Średni spread | [[ data.stats.avgSpread ]] |
| Minimalny rozmiar kontraktu | [[ data.minVolume ]] |
| Minimalny krok | [[ data.stepVolume ]] |
| Prowizja i swap | Prowizja i swap |
| Dźwignia | Dźwignia |
| Godziny handlu | Godziny handlu |
* The spreads provided are a reflection of the time-weighted average. Though TradingMoon attempts to provide competitive spreads during all trading hours, clients should note that these may vary and are susceptible to underlying market conditions. The above is provided for indicative purposes only. Clients are advised to check important news announcements on our Economic Calendar, which may result in the widening of spreads, amongst other instances.
The above spreads are applicable under normal trading conditions. TradingMoon has the right to amend the above spreads according to market conditions as per the 'Terms and Conditions'.
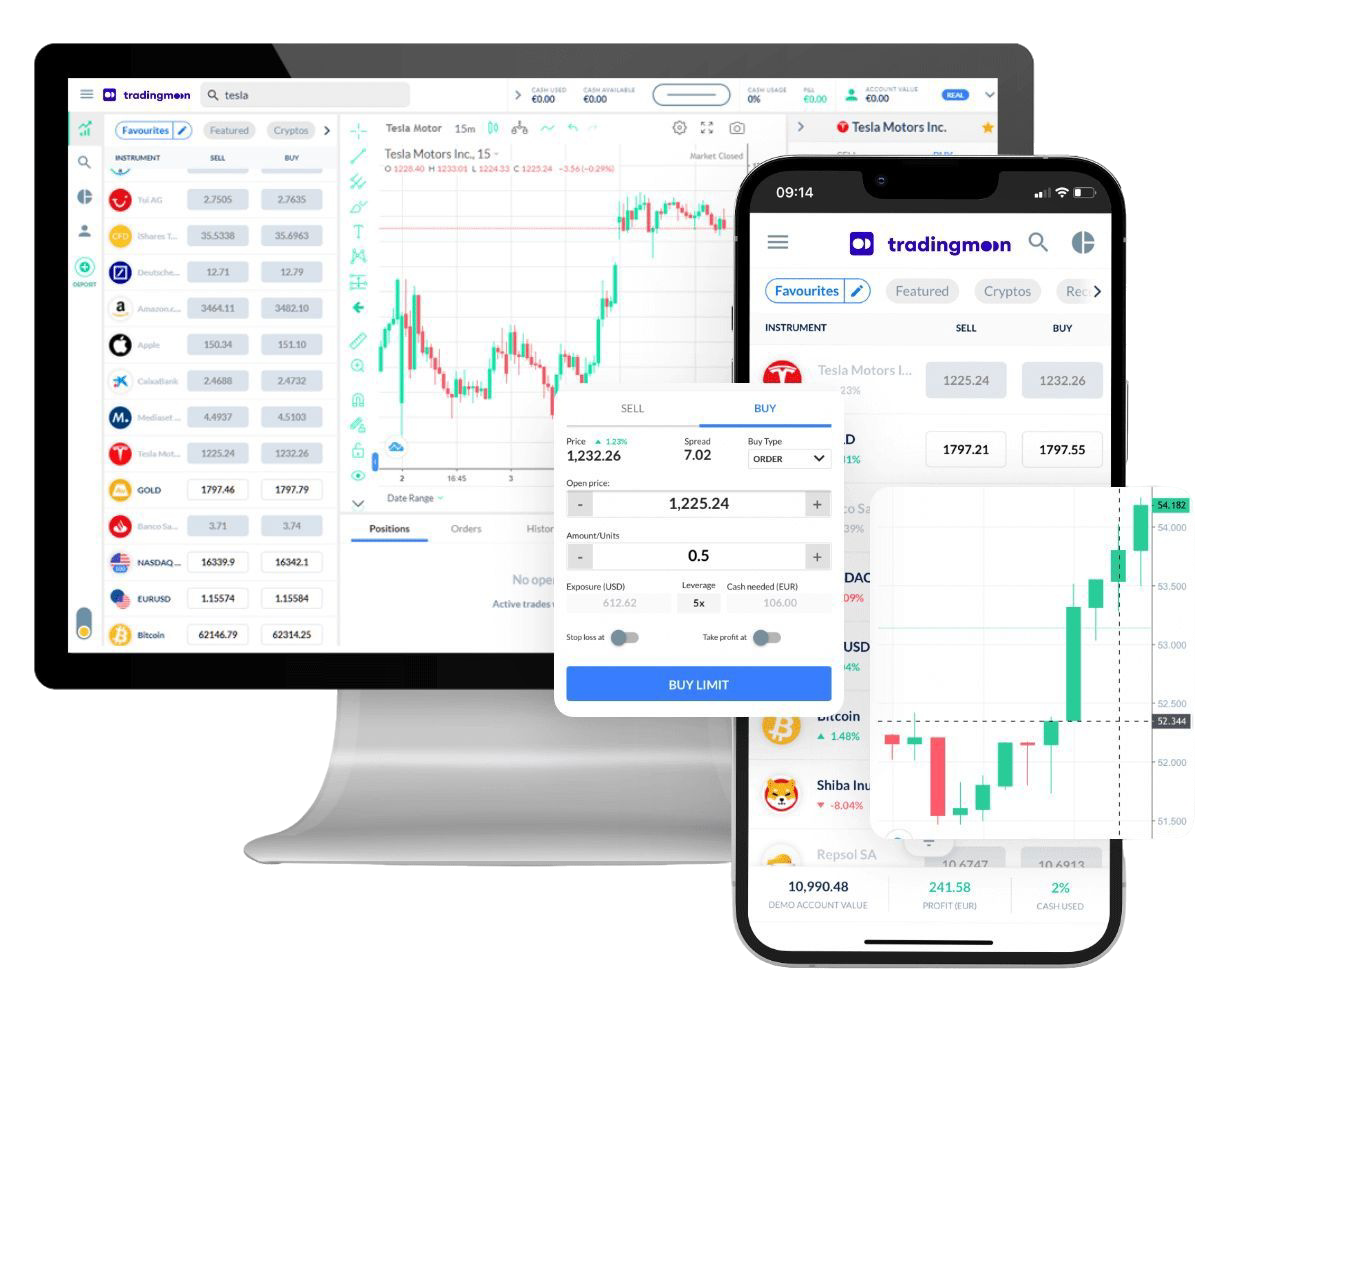
Handluj [[data.name]] z TradingMoon
Wszystko bezproblemowo z elastycznymi rozmiarami transakcji i z zerową prowizją!*
- Handluj 24/5
- Minimalne wymagania dotyczące depozytu zabezpieczającego
- Bez prowizji, tylko spread
- Dostępne udziały ułamkowe
- Łatwa w użyciu platforma
*Mogą obowiązywać inne opłaty.
Dlaczego warto handlować [[data.name]]
Wykorzystaj w pełni fluktuacje cen – bez względu na kierunek, w którym cena się zmienia i bez ograniczeń kapitałowych, które wiążą się z zakupem aktywów bazowych.
CFD
Akcje

Zarabiaj na rosnących cenach (zajmij pozycję długą)


Wykorzystaj spadające ceny (zajmij pozycję krótką)

Handluj z dźwignią
Zajmuj większe pozycje niż gotówka, którą masz do dyspozycji

Handluj na zmienności
Nie musisz być właścicielem aktywu

Brak prowizji
Tylko niskie spready

Zarządzaj ryzykiem za pomocą narzędzi na platformie
Możliwość ustawienia poziomów take profit i stop loss