


[[ data.name ]]
[[ data.ticker ]]
[[ data.price ]] [[ data.change ]] ([[ data.changePercent ]]%)
Niski: [[ data.low ]]
Wysoki: [[ data.high ]]
O
Historia
Różnice między inwestowaniem a handlem
O
Historia
Różnice między inwestowaniem a handlem
Robinhood (HOOD.US) is a financial technology company that offers commission-free online brokerage services and a user-friendly mobile trading app. Founded in 2013 by Vlad Tenev and Baiju Bhatt, it gained popularity for its innovative approach to democratizing stock trading and providing access to various investment options for retail investors. The company allows users to trade stocks, options, ETFs, and cryptocurrencies without paying traditional trading fees.
Robinhood went public through an initial public offering (IPO) on July 29, 2021, and its stock is listed on the US100 exchange. As of June 2023, it has a market capitalization of $8.81 billion. The company aims to make investing more accessible and has attracted a significant user base with its intuitive platform and focus on the retail investing experience.
Robinhood's stock performance has been influenced by various factors, including market trends, internal developments, and broader economic conditions.
Within the past five years, its highest stock price reached $84.12 per share in August 2021, possibly driven by investor optimism about the company's growth prospects and the increasing popularity of retail investing. Conversely, the lowest stock price hit $6.81 per share in June 2022, potentially due to market volatility or company-specific challenges.
To analyze Robinhood's share price history, traders can employ various tools and indicators. Techniques such as moving averages, Relative Strength Index (RSI), and Bollinger Bands may help provide insights into the stock's performance and potential investment opportunities. Additionally, fundamental analysis, which includes examining financial statements, industry trends, and macroeconomic factors, may also provide a deeper understanding of the forces shaping the company's share price.
By combining technical and fundamental analysis, investors and traders may identify trends and potential opportunities within this dynamic market.
When considering trading Robinhood stock, it is important to take into account the competition in the brokerage and financial services industry. Coinbase (COIN.US) is a major competitor, specializing in cryptocurrency exchange and trading services. As one of the largest cryptocurrency platforms globally, Coinbase offers a diverse range of digital assets for trading and investment.
Another notable competitor to consider is Charles Schwab Corp (SCHW.US), a well-established brokerage firm with a comprehensive suite of investment services. Charles Schwab offers a wide range of investment options, including stocks, bonds, mutual funds, and retirement accounts, along with advanced trading tools and research resources.
By understanding the landscape and competition within the industry, investors may gain insights into market trends, service offerings, and potential risks and benefits associated with trading Robinhood stock.
| Swap dla długiej pozycji | [[ data.swapLong ]] punkty |
|---|---|
| Swap dla krótkiej pozycji | [[ data.swapShort ]] punkty |
| Minimalny spread | [[ data.stats.minSpread ]] |
| Średni spread | [[ data.stats.avgSpread ]] |
| Minimalny rozmiar kontraktu | [[ data.minVolume ]] |
| Minimalny krok | [[ data.stepVolume ]] |
| Prowizja i swap | Prowizja i swap |
| Dźwignia | Dźwignia |
| Godziny handlu | Godziny handlu |
* The spreads provided are a reflection of the time-weighted average. Though TradingMoon attempts to provide competitive spreads during all trading hours, clients should note that these may vary and are susceptible to underlying market conditions. The above is provided for indicative purposes only. Clients are advised to check important news announcements on our Economic Calendar, which may result in the widening of spreads, amongst other instances.
The above spreads are applicable under normal trading conditions. TradingMoon has the right to amend the above spreads according to market conditions as per the 'Terms and Conditions'.
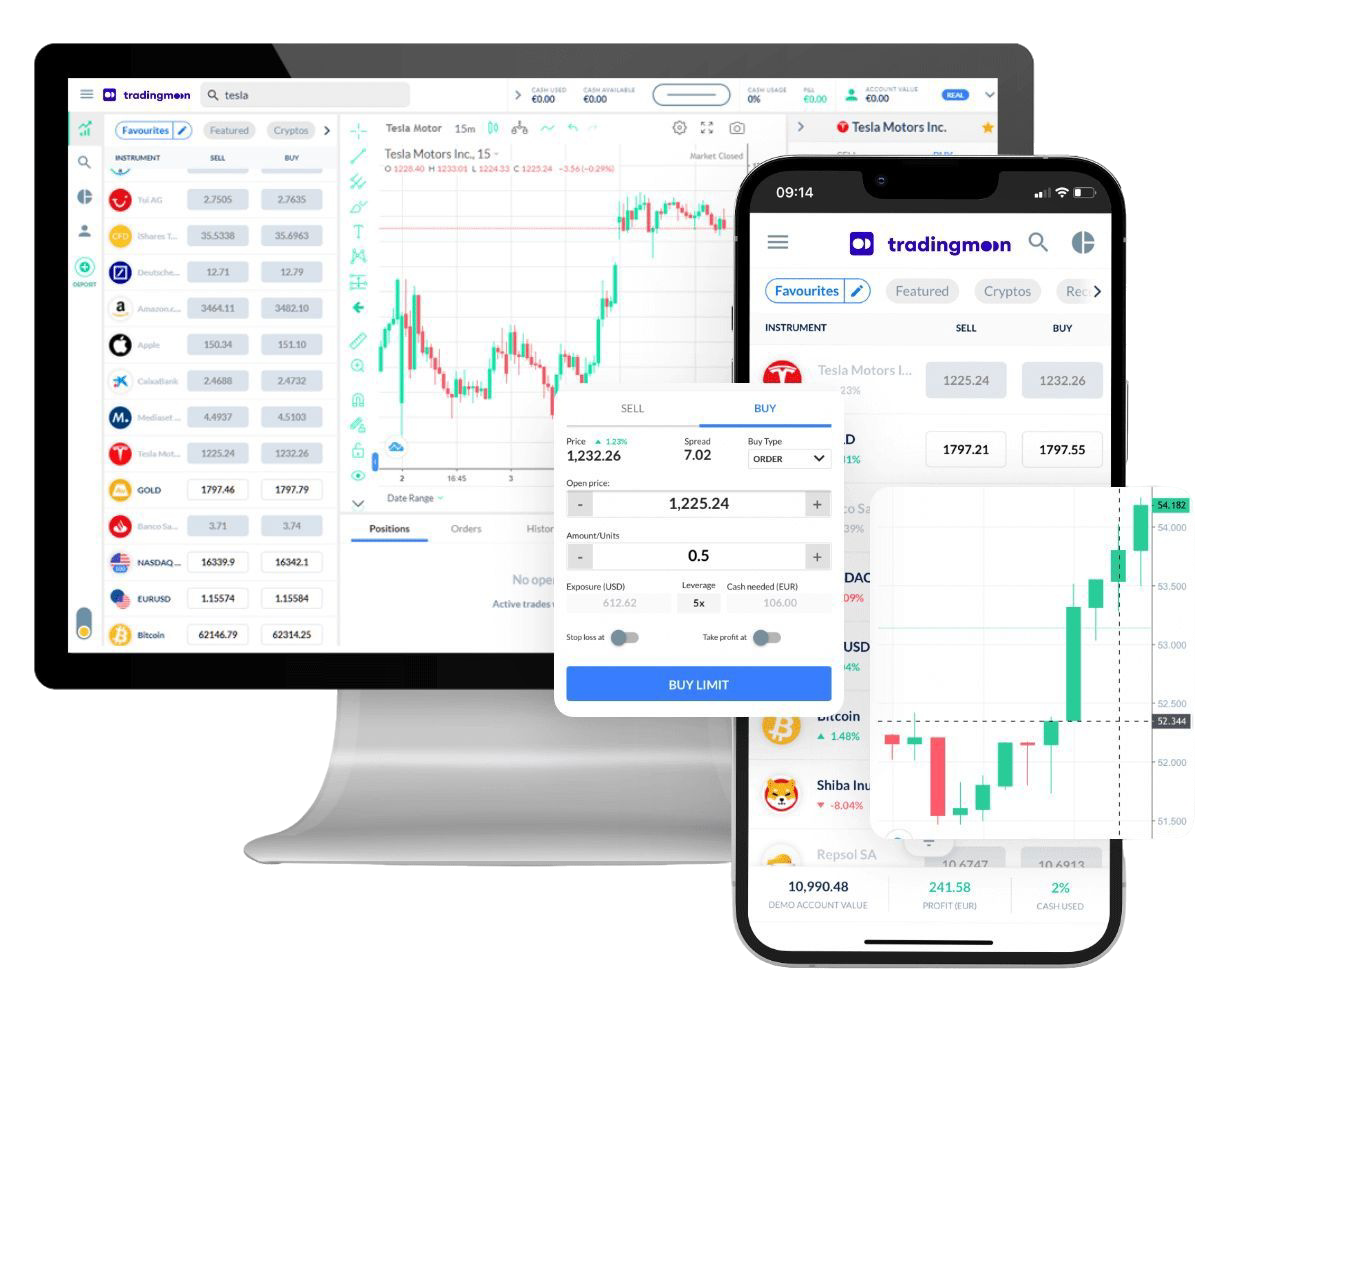
Handluj [[data.name]] z TradingMoon
Wszystko bezproblemowo z elastycznymi rozmiarami transakcji i z zerową prowizją!*
- Handluj 24/5
- Minimalne wymagania dotyczące depozytu zabezpieczającego
- Bez prowizji, tylko spread
- Dostępne udziały ułamkowe
- Łatwa w użyciu platforma
*Mogą obowiązywać inne opłaty.
Dlaczego warto handlować [[data.name]]
Wykorzystaj w pełni fluktuacje cen – bez względu na kierunek, w którym cena się zmienia i bez ograniczeń kapitałowych, które wiążą się z zakupem aktywów bazowych.
CFD
Akcje

Zarabiaj na rosnących cenach (zajmij pozycję długą)


Wykorzystaj spadające ceny (zajmij pozycję krótką)

Handluj z dźwignią
Zajmuj większe pozycje niż gotówka, którą masz do dyspozycji

Handluj na zmienności
Nie musisz być właścicielem aktywu

Brak prowizji
Tylko niskie spready

Zarządzaj ryzykiem za pomocą narzędzi na platformie
Możliwość ustawienia poziomów take profit i stop loss