


[[ data.name ]]
[[ data.ticker ]]
[[ data.price ]] [[ data.change ]] ([[ data.changePercent ]]%)
Niski: [[ data.low ]]
Wysoki: [[ data.high ]]
O
Historia
Różnice między inwestowaniem a handlem
O
Historia
Różnice między inwestowaniem a handlem
Sopra Steria (SOPR.PA) is a leading European information technology services company with a current market cap of €3.58 billion as of 26th June 2023. Founded in 1968 by Pierre Pasquier, François Odin, and Léo Gantelet, the company has grown to become a global player, offering end-to-end IT solutions, consulting, digital services, and software development.
Headquartered in Annecy, France, it specializes in various sectors, including banking, insurance, telecom, aerospace, defense, energy, healthcare, and public services. The company has a strong presence in over 25 countries, employing more than 46,000 people worldwide.
Sopra Steria went public in 1990 on the Euronext Paris stock exchange under the ticker symbol SOPR.PA. Throughout its history, the company has made numerous strategic acquisitions to expand its capabilities and market reach, solidifying its position as a top IT services provider in Europe.
In the past five years, Sopra Steria's stock price reached its highest point at €198.30 in March 2023, showcasing the company's strong performance and positive investor sentiment. Conversely, the lowest stock price of €75.65 occurred in December 2018, possibly due to market uncertainties or temporary setbacks.
To gain a better understanding of the company's stock price movements, traders can utilize various tools and indicators. Technical analysis, for instance, may help investors identify trends and patterns in the stock's historical performance. Tools such as Relative Strength Index (RSI), Line Chart and Pivot Points may offer insights into potential entry and exit points for trades.
Additionally, keeping an eye on company news, financial reports, and industry developments may provide valuable context when analyzing the stock's price history. By combining technical analysis with fundamental research, investors may make informed decisions about the future trajectory of Sopra Steria G stock, while considering the ever-changing market conditions.
Before trading Sopra Steria G stock, it is crucial to consider its competitors within the IT services and consulting industry. They include:
- Atos (ATOS.PA): A multinational IT services corporation specializing in digital transformation, cybersecurity, and cloud computing services. Headquartered in France, Atos operates globally, providing tailored solutions for various industries.
- Accenture (CAN.US): A global professional services company offering a wide range of consulting, technology, and outsourcing solutions across diverse industries. With its strong presence in over 120 countries, Accenture is a key player in the market.
By analyzing the performance, growth strategies, and market positioning of these competitors, investors may gain valuable insights into the industry dynamics and better assess the potential of Sopra Steria stock in the market.
| Swap dla długiej pozycji | [[ data.swapLong ]] punkty |
|---|---|
| Swap dla krótkiej pozycji | [[ data.swapShort ]] punkty |
| Minimalny spread | [[ data.stats.minSpread ]] |
| Średni spread | [[ data.stats.avgSpread ]] |
| Minimalny rozmiar kontraktu | [[ data.minVolume ]] |
| Minimalny krok | [[ data.stepVolume ]] |
| Prowizja i swap | Prowizja i swap |
| Dźwignia | Dźwignia |
| Godziny handlu | Godziny handlu |
* The spreads provided are a reflection of the time-weighted average. Though TradingMoon attempts to provide competitive spreads during all trading hours, clients should note that these may vary and are susceptible to underlying market conditions. The above is provided for indicative purposes only. Clients are advised to check important news announcements on our Economic Calendar, which may result in the widening of spreads, amongst other instances.
The above spreads are applicable under normal trading conditions. TradingMoon has the right to amend the above spreads according to market conditions as per the 'Terms and Conditions'.
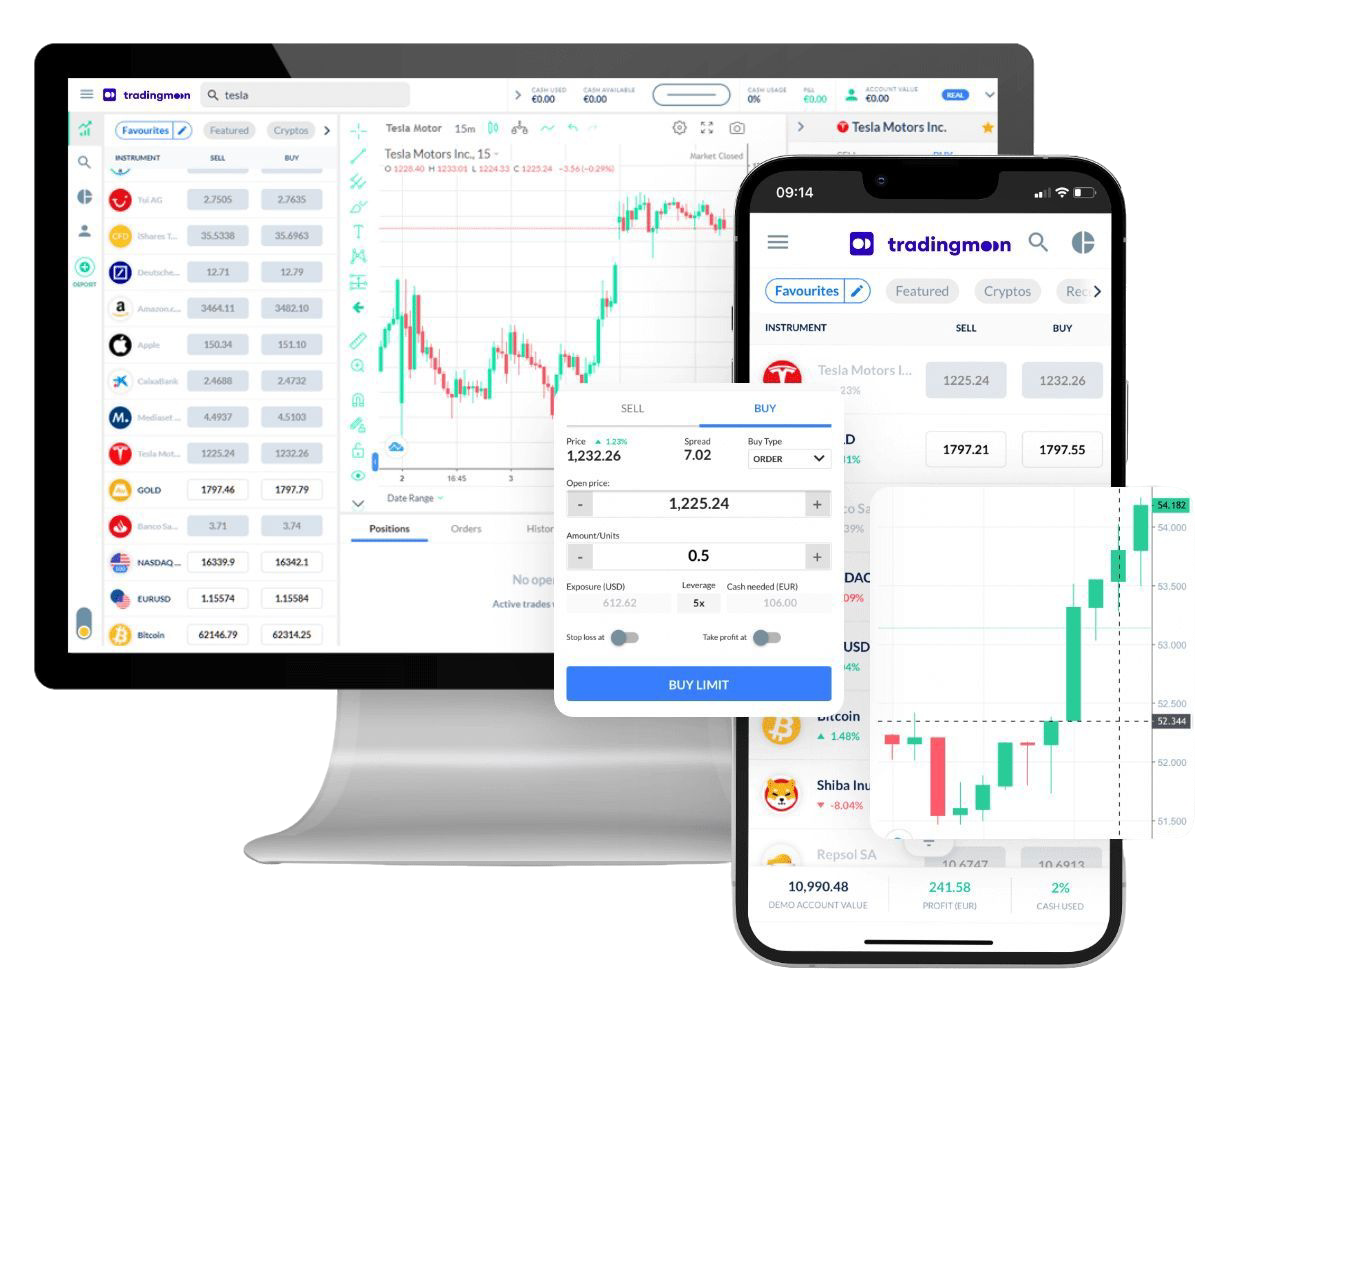
Handluj [[data.name]] z TradingMoon
Wszystko bezproblemowo z elastycznymi rozmiarami transakcji i z zerową prowizją!*
- Handluj 24/5
- Minimalne wymagania dotyczące depozytu zabezpieczającego
- Bez prowizji, tylko spread
- Dostępne udziały ułamkowe
- Łatwa w użyciu platforma
*Mogą obowiązywać inne opłaty.
Dlaczego warto handlować [[data.name]]
Wykorzystaj w pełni fluktuacje cen – bez względu na kierunek, w którym cena się zmienia i bez ograniczeń kapitałowych, które wiążą się z zakupem aktywów bazowych.
CFD
Akcje

Zarabiaj na rosnących cenach (zajmij pozycję długą)


Wykorzystaj spadające ceny (zajmij pozycję krótką)

Handluj z dźwignią
Zajmuj większe pozycje niż gotówka, którą masz do dyspozycji

Handluj na zmienności
Nie musisz być właścicielem aktywu

Brak prowizji
Tylko niskie spready

Zarządzaj ryzykiem za pomocą narzędzi na platformie
Możliwość ustawienia poziomów take profit i stop loss