


[[ data.name ]]
[[ data.ticker ]]
[[ data.price ]] [[ data.change ]] ([[ data.changePercent ]]%)
Niski: [[ data.low ]]
Wysoki: [[ data.high ]]
O
Historia
Różnice między inwestowaniem a handlem
O
Historia
Różnice między inwestowaniem a handlem
The SPDR Oil & Gas Equipment & Services ETF (XES.US) is an exchange-traded fund designed to track the performance of companies engaged in the oil and gas equipment and services sector. With a market capitalization of $350.06 million as of August 4, 2023, the ETF offers investors exposure to the oil and gas industry's supply chain, including companies involved in drilling, exploration, and production services.
It was launched by State Street Global Advisors in June 2006 as part of the SPDR family of ETFs. The fund allows investors to gain diversified exposure to companies that support the oil and gas sector's operations.
In October 2018, SPDR Oil & Gas E&S ETF (XES.US) hit the highest price of $176.50, and in March 2020, the ETF had its lowest price of $2.20. These two points demonstrate the high volatility of the fund. Any investor or trader planning to invest or trade in this ETF should, therefore, exercise caution. One trading strategy that traders may use when trading this ETF is to employ technical analysis and see if there is a trend, particularly long-term. Besides, since the fund includes companies in the oil and gas industry, keeping an eye on global oil prices might be handy.
For those analysing the stock, they could employ various tools and indicators. Examples of these indicators include moving averages, relative strength index (RSI), and Bollinger Bands. These tools could help traders and investors have a better understanding of the ETF's movement.
As an investor or trader, you always want to make informed decisions before putting your money in ETFs. Before you start trading SPDR Oil & Gas E&S, it's worth considering some of its competitors in the market. They include:
- The Energy Select Sector SPDR Fund (XLE.US): It is one of the largest ETFs that offer exposure to the energy sector. It represents the energy component of the SPX500 index and is the benchmark for energy funds. XLE tracks the performance of major US-based companies such as Exxon Mobil, Chevron, and ConocoPhillips.
- The SPDR S&P Oil & Gas Exploration & Production ETF (XOP.US): XOP offers exposure to the exploration and production sub-sector of the energy industry. The ETF invests in companies involved in the exploration, development, and production of crude oil and natural gas reserves.
| Swap dla długiej pozycji | [[ data.swapLong ]] punkty |
|---|---|
| Swap dla krótkiej pozycji | [[ data.swapShort ]] punkty |
| Minimalny spread | [[ data.stats.minSpread ]] |
| Średni spread | [[ data.stats.avgSpread ]] |
| Minimalny rozmiar kontraktu | [[ data.minVolume ]] |
| Minimalny krok | [[ data.stepVolume ]] |
| Prowizja i swap | Prowizja i swap |
| Dźwignia | Dźwignia |
| Godziny handlu | Godziny handlu |
* The spreads provided are a reflection of the time-weighted average. Though TradingMoon attempts to provide competitive spreads during all trading hours, clients should note that these may vary and are susceptible to underlying market conditions. The above is provided for indicative purposes only. Clients are advised to check important news announcements on our Economic Calendar, which may result in the widening of spreads, amongst other instances.
The above spreads are applicable under normal trading conditions. TradingMoon has the right to amend the above spreads according to market conditions as per the 'Terms and Conditions'.
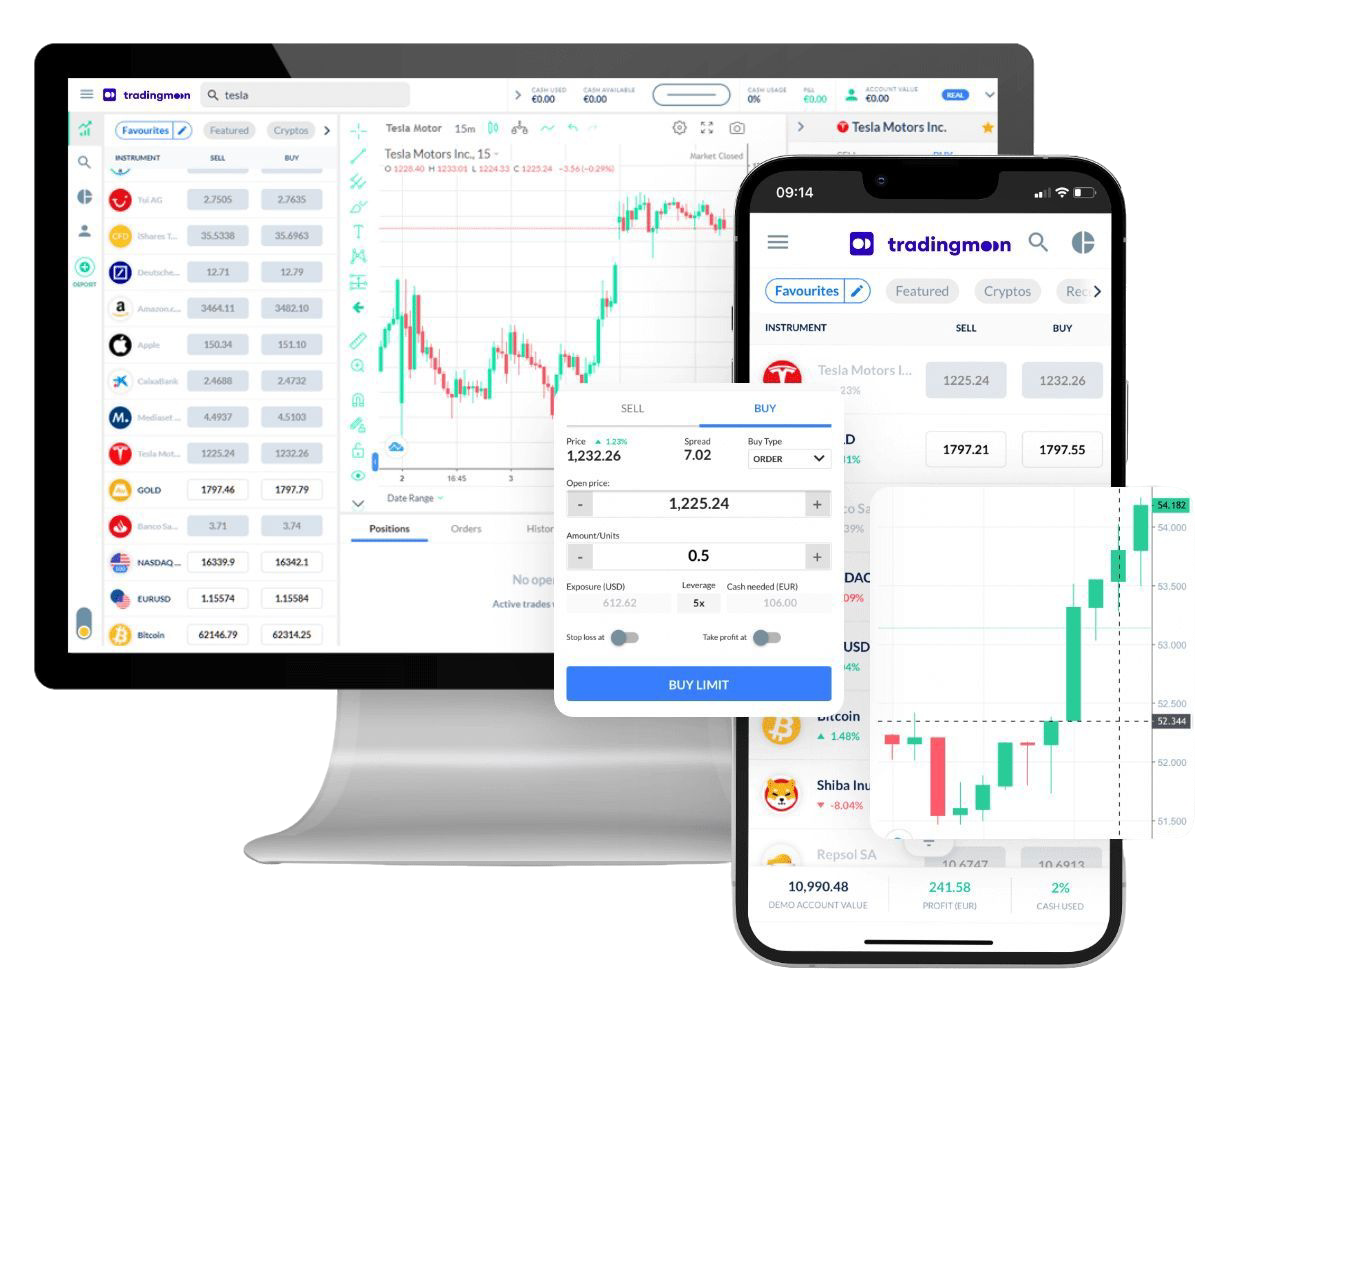
Handluj [[data.name]] z TradingMoon
Wszystko bezproblemowo z elastycznymi rozmiarami transakcji i z zerową prowizją!*
- Handluj 24/5
- Minimalne wymagania dotyczące depozytu zabezpieczającego
- Bez prowizji, tylko spread
- Dostępne udziały ułamkowe
- Łatwa w użyciu platforma
*Mogą obowiązywać inne opłaty.
Dlaczego warto handlować [[data.name]]
Wykorzystaj w pełni fluktuacje cen – bez względu na kierunek, w którym cena się zmienia i bez ograniczeń kapitałowych, które wiążą się z zakupem aktywów bazowych.
CFD
Akcje

Zarabiaj na rosnących cenach (zajmij pozycję długą)


Wykorzystaj spadające ceny (zajmij pozycję krótką)

Handluj z dźwignią
Zajmuj większe pozycje niż gotówka, którą masz do dyspozycji

Handluj na zmienności
Nie musisz być właścicielem aktywu

Brak prowizji
Tylko niskie spready

Zarządzaj ryzykiem za pomocą narzędzi na platformie
Możliwość ustawienia poziomów take profit i stop loss