


[[ data.name ]]
[[ data.ticker ]]
[[ data.price ]] [[ data.change ]] ([[ data.changePercent ]]%)
Niski: [[ data.low ]]
Wysoki: [[ data.high ]]
O
Historia
Różnice między inwestowaniem a handlem
O
Historia
Różnice między inwestowaniem a handlem
TGS Nopec (TGS.NO) is a prominent Norwegian geoscience company with a market capitalization of 19.17 billion NOK as of September 19th, 2023. Founded in 1981, it has a rich history in the exploration industry, specializing in providing geological data, multi-client seismic surveys, and other geophysical services to support the global energy sector.
Over the years, it has developed cutting-edge technologies and amassed extensive geological data to assist oil and gas companies in their exploration and production efforts. It went public and was listed on the Oslo Stock Exchange (OSE) in 1993. Since then, it has grown to become a key player in the geoscience and seismic data industry, serving clients worldwide.
TGS's stock price ranged between 77.24 NOK and 347.10 NOK within the past five years. Its all-time high of 347.10 NOK was reached in October 2018, while its all-time low of 77.24 NOK was recorded in October 2021.
Traders who want to trade the stock may consider using different trading strategies, depending on their risk appetite and timeframe. For instance, day traders may aim to profit from the stock's intraday price movements, usually holding their positions for a few hours or less. Swing traders, on the other hand, may hold their positions for several days or weeks, aiming to profit from the stock's short-term trends. Position traders may target a longer-term horizon, holding their positions for months or years.
In addition to trading strategies, traders may also use various tools and indicators to analyse the stock. For example, moving averages could help traders identify the stock's trend direction and potential levels of support and resistance.
Before you jump into trading TGS ASA stock, it's essential to consider the company's competition in the market. The competitors include but not limited to:
- Schlumberger (SLB.US): Schlumberger is a prominent American multinational oilfield services company. Founded in 1926 by Conrad and Marcel Schlumberger, it has become a global leader in providing a wide range of services and technologies to the oil and gas industry. Schlumberger offers expertise in reservoir characterization, drilling, production, and processing to help oil and gas companies optimize their operations.
- PGS (PGS.NO): Petroleum Geo-Services (PGS) is a Norwegian geophysical services company specializing in providing advanced seismic solutions to the oil and gas industry. Founded in 1991 and headquartered in Oslo, Norway, PGS offers a wide range of geophysical services, including seismic data acquisition, imaging, reservoir monitoring, and data analysis.
| Swap dla długiej pozycji | [[ data.swapLong ]] punkty |
|---|---|
| Swap dla krótkiej pozycji | [[ data.swapShort ]] punkty |
| Minimalny spread | [[ data.stats.minSpread ]] |
| Średni spread | [[ data.stats.avgSpread ]] |
| Minimalny rozmiar kontraktu | [[ data.minVolume ]] |
| Minimalny krok | [[ data.stepVolume ]] |
| Prowizja i swap | Prowizja i swap |
| Dźwignia | Dźwignia |
| Godziny handlu | Godziny handlu |
* The spreads provided are a reflection of the time-weighted average. Though TradingMoon attempts to provide competitive spreads during all trading hours, clients should note that these may vary and are susceptible to underlying market conditions. The above is provided for indicative purposes only. Clients are advised to check important news announcements on our Economic Calendar, which may result in the widening of spreads, amongst other instances.
The above spreads are applicable under normal trading conditions. TradingMoon has the right to amend the above spreads according to market conditions as per the 'Terms and Conditions'.
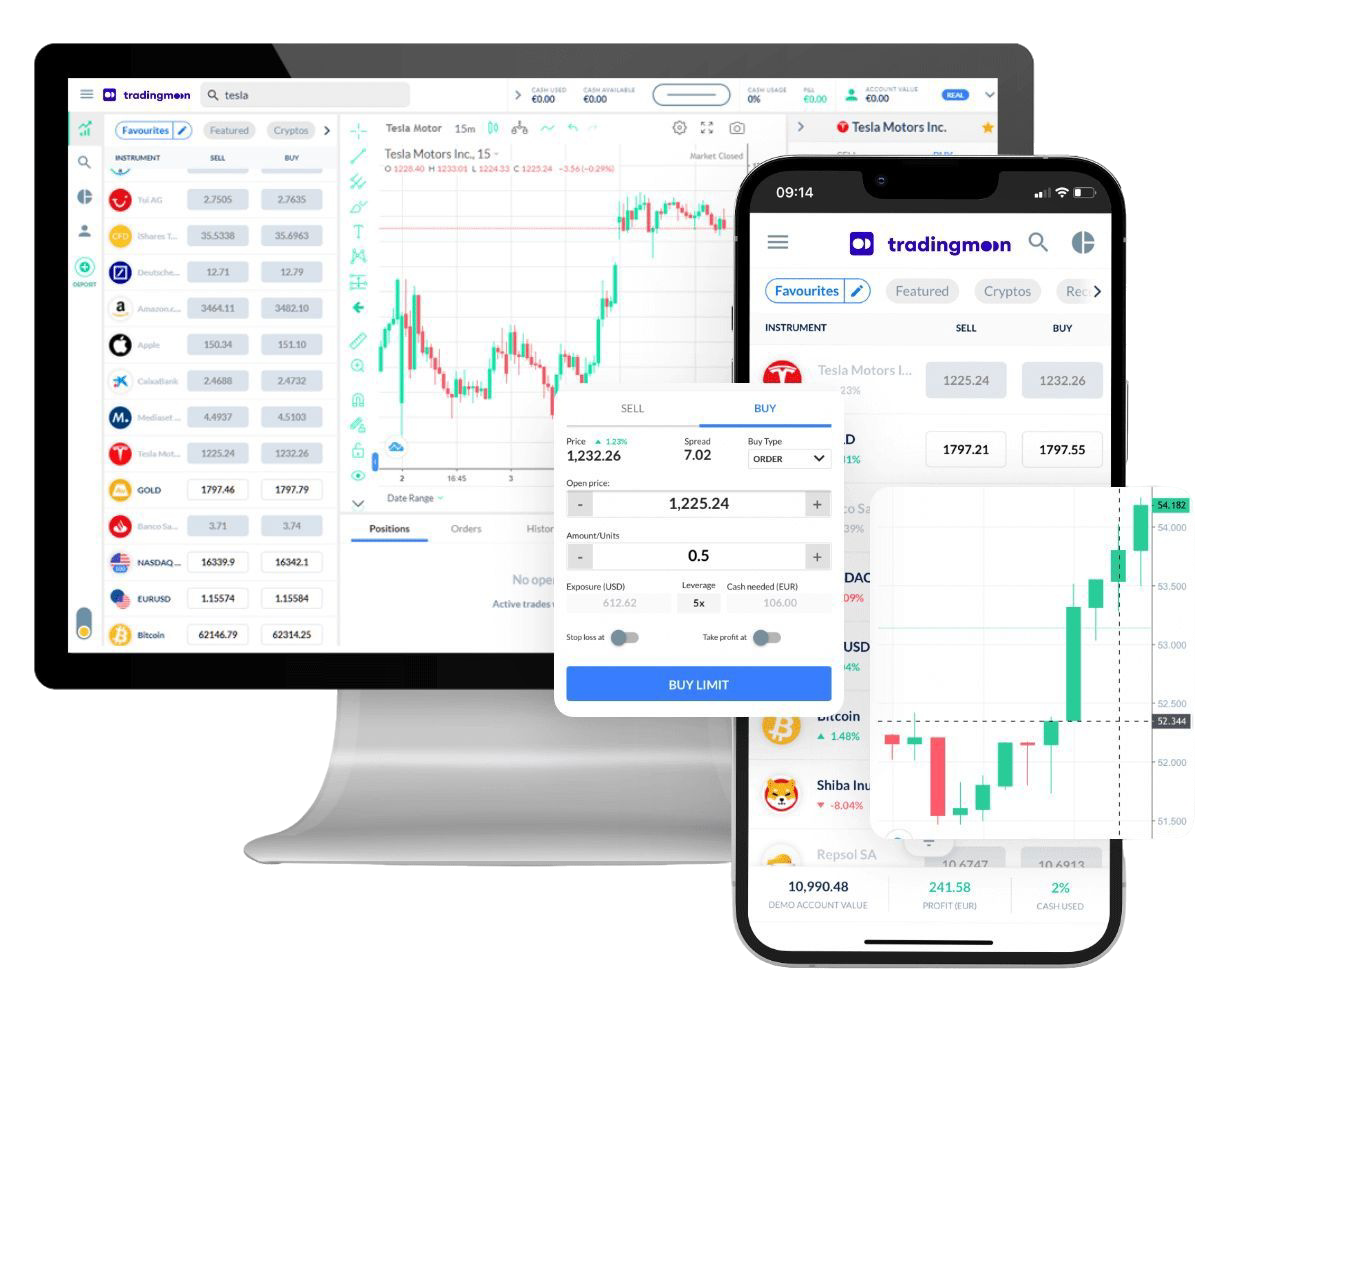
Handluj [[data.name]] z TradingMoon
Wszystko bezproblemowo z elastycznymi rozmiarami transakcji i z zerową prowizją!*
- Handluj 24/5
- Minimalne wymagania dotyczące depozytu zabezpieczającego
- Bez prowizji, tylko spread
- Dostępne udziały ułamkowe
- Łatwa w użyciu platforma
*Mogą obowiązywać inne opłaty.
Dlaczego warto handlować [[data.name]]
Wykorzystaj w pełni fluktuacje cen – bez względu na kierunek, w którym cena się zmienia i bez ograniczeń kapitałowych, które wiążą się z zakupem aktywów bazowych.
CFD
Akcje

Zarabiaj na rosnących cenach (zajmij pozycję długą)


Wykorzystaj spadające ceny (zajmij pozycję krótką)

Handluj z dźwignią
Zajmuj większe pozycje niż gotówka, którą masz do dyspozycji

Handluj na zmienności
Nie musisz być właścicielem aktywu

Brak prowizji
Tylko niskie spready

Zarządzaj ryzykiem za pomocą narzędzi na platformie
Możliwość ustawienia poziomów take profit i stop loss