
[[ data.name ]]
[[ data.ticker ]]
[[ data.price ]] [[ data.change ]] ([[ data.changePercent ]]%)
Minim: [[ data.low ]]
Maxim: [[ data.high ]]
Despre
Istorie
Diferențe între investiție și tranzacționare
Despre
Istorie
Diferențe între investiție și tranzacționare
Verizon Communications Inc. (VZ.US), a titan in the telecommunications industry, boasts a market capitalization of $146.55 billion as of July 13, 2023. This American multinational conglomerate was founded in 1983 as Bell Atlantic and later rebranded as Verizon in 2000 following a merger with GTE.
The company went public in 1984 and has been part of the US 30 Industrial Average since 2004. Founded by Raymond W. Smith and Charles Lee, it provides wireless services, internet access, and other products to millions of customers worldwide. Over the years, it has made significant strides in innovation and connectivity, solidifying its position as a global leader in telecommunication services.
Verizon's stock price history has seen many ups and downs over the years. The highest stock price reached by Verizon was $62.22 in December 2019, while the lowest stock price reached was $33.72 in June 2020. As an investor or trader, you may use various trading strategies, tools, and indicators to analyze Verizon's stock prices. One such tool that may come in handy is the moving average, which shows an asset's average price over a specific period.
The 50-day and 200-day moving averages are commonly used to identify long-term trends and potential support and resistance levels. Being aware of various trading strategies, tools, and indicators may help investors and traders make informed decisions and optimize their strategies. As always, one must remember that the past performance may not indicate future results, and it is essential to exercise caution and diversify portfolio.
While the stock price of Verizon may be appealing, it's important to consider the competitors in the industry that may also present attractive investment opportunities. They include:
- Charter Communications (CHTR.US) - Charter has been aggressively expanding into the wireless industry, and currently offers wireless services under the brand name, Spectrum Mobile. While still a nascent player in the telecommunication industry, Charter's growth potential make it an intriguing investment.
- Comcast (CMCSA.US) - While primarily known for its cable offerings, Comcast also competes with Verizon in the wireless space through its subsidiary, Xfinity Mobile. Comcast has been steadily expanding its wireless offerings and currently has a subscriber base of around 3 million customers. Comcast's broad offering of services makes it a compelling option for investors looking for a diverse investment portfolio.
| Swap lung | [[ data.swapLong ]] puncte |
|---|---|
| Swap scurt | [[ data.swapShort ]] puncte |
| Spread min | [[ data.stats.minSpread ]] |
| Spread mediu | [[ data.stats.avgSpread ]] |
| Dimensiune minimă contract | [[ data.minVolume ]] |
| Dimensiune minimă pas | [[ data.stepVolume ]] |
| Comision și swap | Comision și swap |
| Levier | Levier |
| Ore de tranzacționare | Ore de tranzacționare |
* The spreads provided are a reflection of the time-weighted average. Though TradingMoon attempts to provide competitive spreads during all trading hours, clients should note that these may vary and are susceptible to underlying market conditions. The above is provided for indicative purposes only. Clients are advised to check important news announcements on our Economic Calendar, which may result in the widening of spreads, amongst other instances.
The above spreads are applicable under normal trading conditions. TradingMoon has the right to amend the above spreads according to market conditions as per the 'Terms and Conditions'.
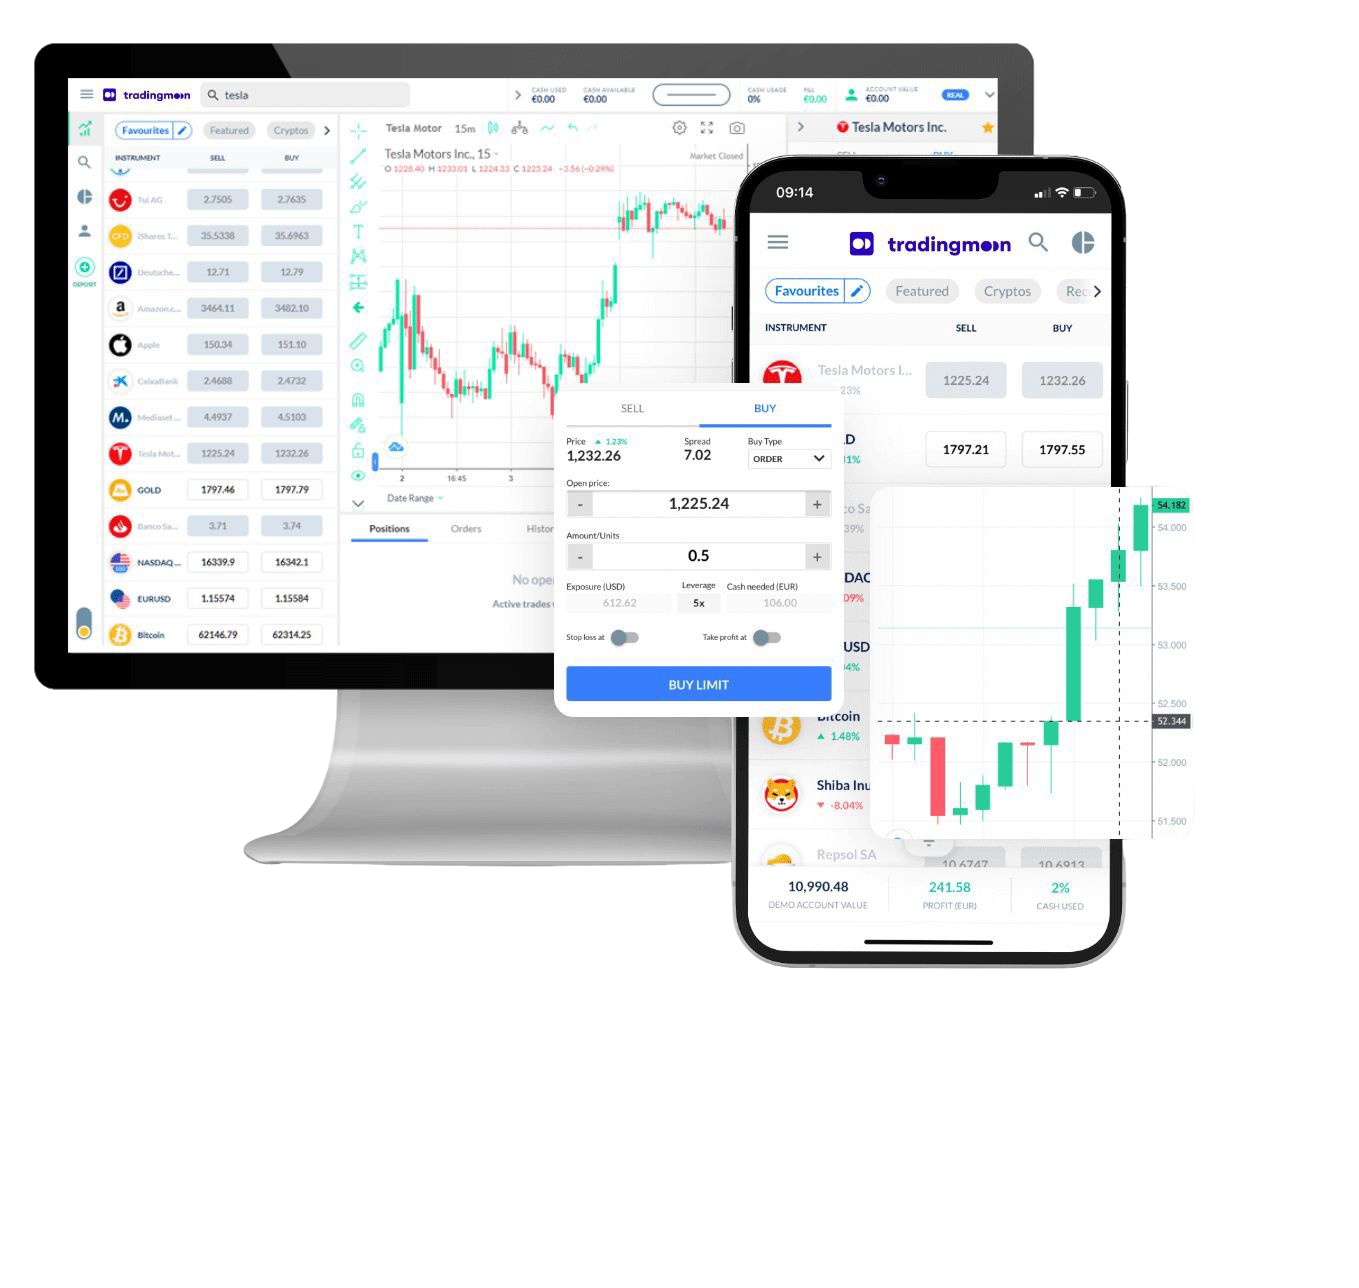
Tranzacționează [[data.name]] cu TradingMoon
Toate fără probleme, cu dimensiuni de tranzacționare flexibile și cu zero comisioane!*
- Tranzacționează 24/5
- Cerințe de marjă minimă
- Fără comision, doar spread-uri
- Acțiuni fracționate disponibile
- Platformă ușor de utilizat
*Se pot aplica alte taxe.
De ce să tranzacționezi [[data.name]]
Profitați la maximum de fluctuațiile prețului - indiferent în ce direcție variază prețul și fără restricții de capital care vin odată cu cumpărarea activului suport.
CFD-uri
Acțiuni
Profitați de prețurile în creștere (poziție long)
Capitalizați pe scăderea prețurilor
Tranzacționați cu levier
Dețineți poziții mai mari decât numerarul disponibil
Tranzacționați pe volatilitate
Nu este nevoie să dețineți activul
Fără comisioane
Doar spreaduri mici
Gestionați riscul cu instrumente din platformă
Posibilitatea de a seta niveluri de take profit și stop loss