


[[ data.name ]]
[[ data.ticker ]]
[[ data.price ]] [[ data.change ]] ([[ data.changePercent ]]%)
Low: [[ data.low ]]
High: [[ data.high ]]
About
History
Why trade?
About
History
Why trade?
AUS 200 tracks the S&P/ASX 200, Australia's benchmark share market index. It is made up of around 200 of the largest companies listed on the Australian Securities Exchange (ASX), weighted by float-adjusted market capitalisation. The index is maintained by S&P Dow Jones Indices and was launched in April 2000.
Because it covers sectors such as financials, materials, healthcare and energy, the index is widely used as a broad gauge of the Australian share market. Banks and mining companies make up a large part of the index, so it can be sensitive to interest rates and commodity prices.
The S&P/ASX 200 was launched on 3 April 2000, with a starting value equal to the All Ordinaries index on that date. Since then, it has gone through several major cycles, including a sharp fall during the global financial crisis of 2008–2009 and a steep drop in early 2020. Both falls were later recovered, and the index has since reached new record highs.
Understanding the index's price history can help traders put current moves into context. Past performance is not a reliable indicator of future results.
AUS 200 gives traders exposure to the Australian share market through a single instrument. The index can react to company earnings, interest rate decisions by the Reserve Bank of Australia, commodity prices, economic data from China, Australia's largest trading partner, and global risk sentiment. As with all CFD trading, trading AUS 200 involves risk, and leveraged positions can lead to significant losses.
| Swap long | [[ data.swapLong ]] points |
|---|---|
| Swap short | [[ data.swapShort ]] points |
| Spread min | [[ data.stats.minSpread ]] |
| Spread avg | [[ data.stats.avgSpread ]] |
| Min contract size | [[ data.minVolume ]] |
| Min step size | [[ data.stepVolume ]] |
| Commission and Swap | Commission and Swap |
| Leverage | Leverage |
| Trading Hours | Trading Hours |
* The spreads provided are a reflection of the time-weighted average. Though TradingMoon attempts to provide competitive spreads during all trading hours, clients should note that these may vary and are susceptible to underlying market conditions. The above is provided for indicative purposes only. Clients are advised to check important news announcements on our Economic Calendar, which may result in the widening of spreads, amongst other instances.
The above spreads are applicable under normal trading conditions. TradingMoon has the right to amend the above spreads according to market conditions as per the 'Terms and Conditions'.
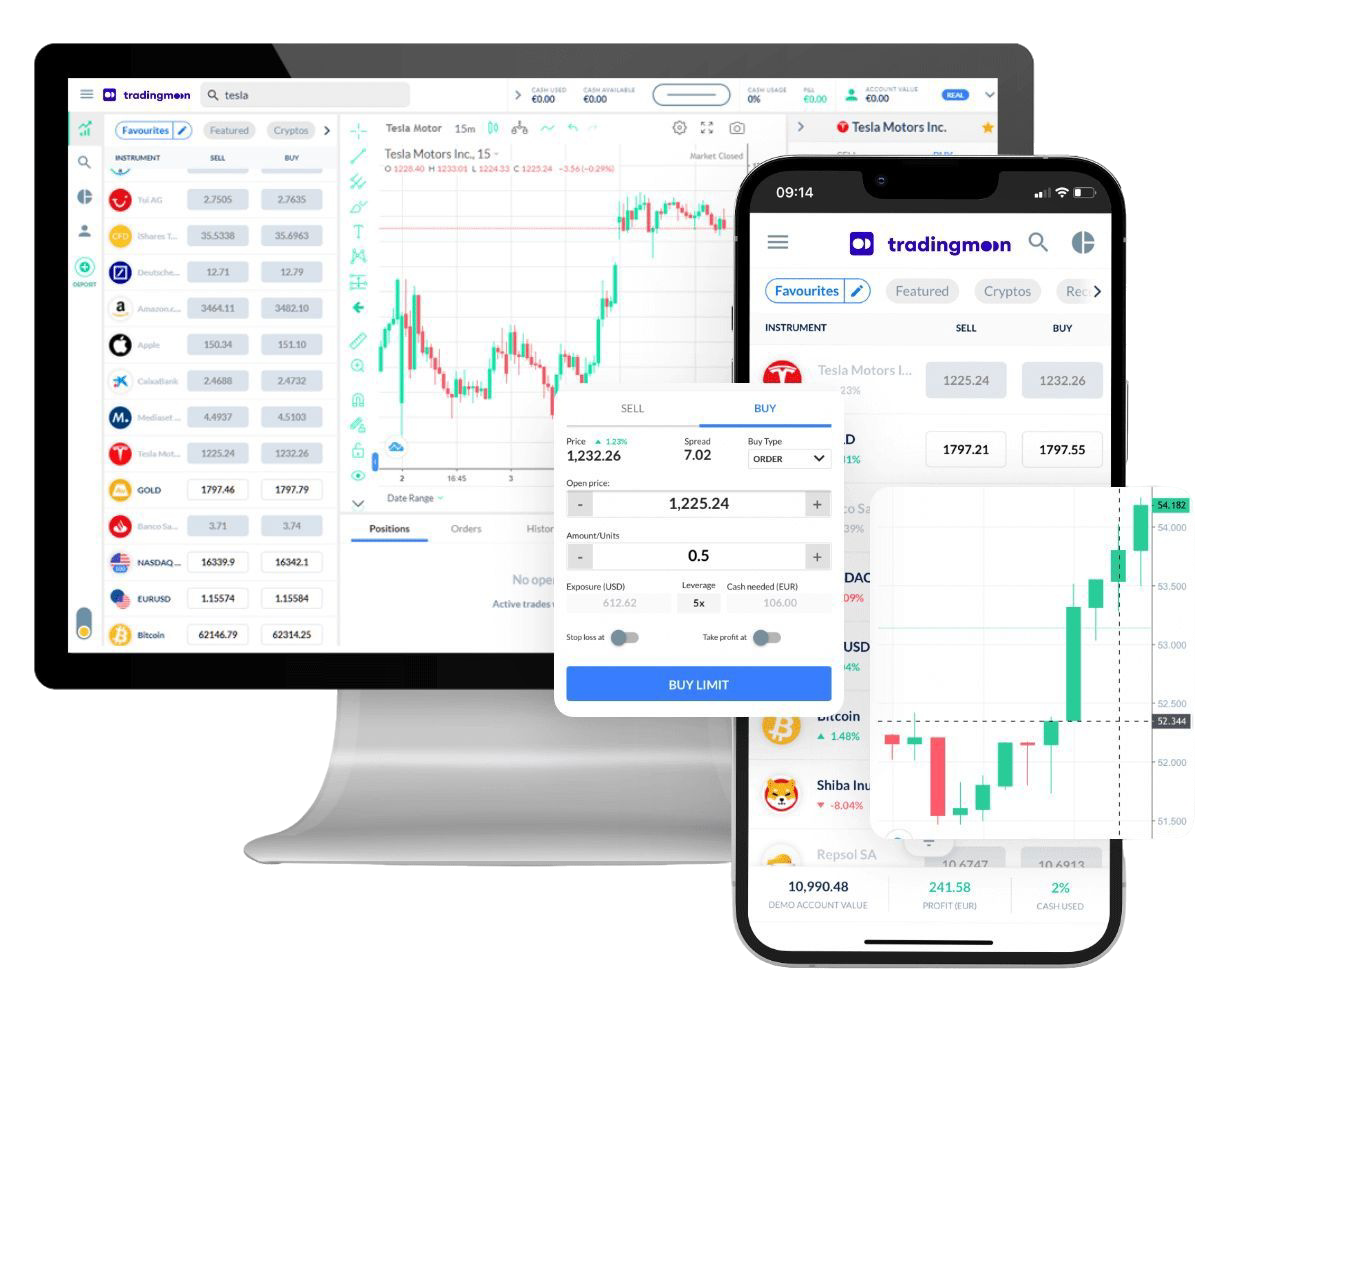
Trade [[data.name]] with TradingMoon
All major indices at industry-leading pricing.
Gain exposure to global markets via lower-risk, stock market indices.
- Trade 24/5
- Minimum margin requirements
- The tightest spreads
- Easy to use platform
Why Trade [[data.name]]
Make the most of price fluctuations - no matter what direction the price swings and without capital restrictions that come with buying the underlying asset.
CFDs
Indices

Capitalise on rising prices (go long)


Capitalise on falling prices (go short)

Trade with leverage
Hold larger positions than the cash you have at your disposal

Trade on volatility
No need to own the asset

No commissions
Just low spreads

Manage risk with in-platform tools
Ability to set take profit and stop loss levels