


[[ data.name ]]
[[ data.ticker ]]
[[ data.price ]] [[ data.change ]] ([[ data.changePercent ]]%)
Niski: [[ data.low ]]
Wysoki: [[ data.high ]]
O
Historia
Różnice między inwestowaniem a handlem
O
Historia
Różnice między inwestowaniem a handlem
AUS 200 is a stock index that measures the performance of the Australian equity market. It consists of the 200 largest stocks listed on the Australian Securities Exchange (ASX), and is one of the most commonly traded assets in Australia. The index was launched in 2000, and provides investors with a reliable barometer to measure broad economic trends in the country.
AUS 200 offers traders a great opportunity to take advantage of global economic events that have an effect on the Australian market. With its large base of diverse stocks, AUS 200 allows investors to gain exposure to multiple sectors in one single trade. It is also relatively liquid compared to other markets, providing traders with higher liquidity and lower transaction costs. Furthermore, AUS 200 is considered to be a major indicator of the Australian economy, making it an important asset for traders looking to gain insight into the country’s market performance.
The Australia 200 has had a remarkable run in recent years. At its lowest point in March 2009, the index was trading at 3145.50 points before going on to reach an all-time high of 7628.90 points in August 2021 - more than double its previous peak! It's been a wild ride for traders and investors alike, but it looks like the Aussie market is here to stay.
With such a long history of ups and downs, keeping track of the price history for the Australia 200 is essential for any trader. Taking the time to understand the price action can help you make better-informed decisions and potentially identify upcoming opportunities in the market.
Traders can benefit from trading AUS 200 due to its high liquidity and low spreads. This means traders can enter and exit positions quickly and cheaply, increasing the potential for profits. In addition, trading AUS 200 provides a great way to diversify portfolios due to its broad range of sectors.
The index is also very volatile compared to other indices, giving traders more chances to take advantage of market movements. With a wide range of long and short-term trading strategies available, traders can take advantage of both uptrends and downtrends in the AUS 200.
| Swap dla długiej pozycji | [[ data.swapLong ]] punkty |
|---|---|
| Swap dla krótkiej pozycji | [[ data.swapShort ]] punkty |
| Minimalny spread | [[ data.stats.minSpread ]] |
| Średni spread | [[ data.stats.avgSpread ]] |
| Minimalny rozmiar kontraktu | [[ data.minVolume ]] |
| Minimalny krok | [[ data.stepVolume ]] |
| Prowizja i swap | Prowizja i swap |
| Dźwignia | Dźwignia |
| Godziny handlu | Godziny handlu |
* The spreads provided are a reflection of the time-weighted average. Though TradingMoon attempts to provide competitive spreads during all trading hours, clients should note that these may vary and are susceptible to underlying market conditions. The above is provided for indicative purposes only. Clients are advised to check important news announcements on our Economic Calendar, which may result in the widening of spreads, amongst other instances.
The above spreads are applicable under normal trading conditions. TradingMoon has the right to amend the above spreads according to market conditions as per the 'Terms and Conditions'.
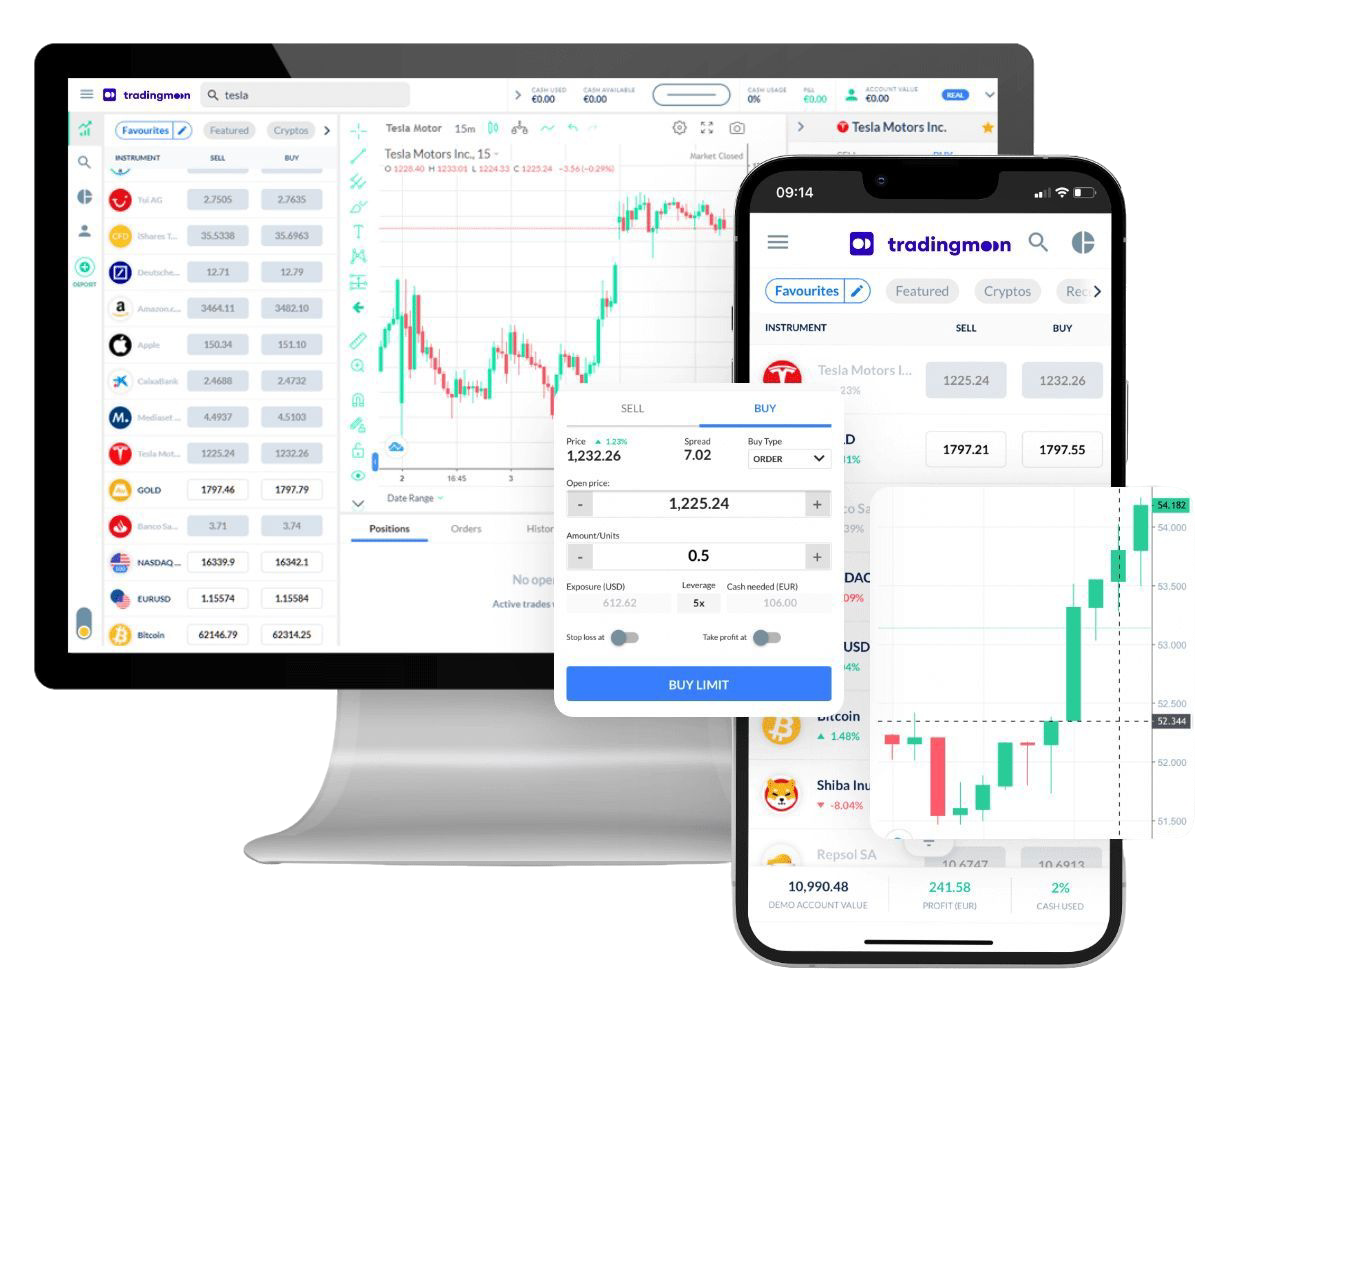
Handluj [[data.name]] z TradingMoon
Wszystkie główne indeksy w najlepszych w branży cenach.
Uzyskaj ekspozycję na rynki światowe dzięki indeksom giełdowym o niższym ryzyku.
- Handluj 24/5
- Minimalne wymagania dotyczące depozytu zabezpieczającego
- Najciaśniejsze spready
- Łatwa w użyciu platforma
Dlaczego warto handlować [[data.name]]
Wykorzystaj w pełni fluktuacje cen – bez względu na kierunek, w którym cena się zmienia i bez ograniczeń kapitałowych, które wiążą się z zakupem aktywów bazowych.
CFD
Indeksy

Zarabiaj na rosnących cenach (zajmij pozycję długą)


Wykorzystaj spadające ceny (zajmij pozycję krótką)

Handluj z dźwignią
Zajmuj większe pozycje niż gotówka, którą masz do dyspozycji

Handluj na zmienności
Nie musisz być właścicielem aktywu

Brak prowizji
Tylko niskie spready

Zarządzaj ryzykiem za pomocą narzędzi na platformie
Możliwość ustawienia poziomów take profit i stop loss