


[[ data.name ]]
[[ data.ticker ]]
[[ data.price ]] [[ data.change ]] ([[ data.changePercent ]]%)
Niski: [[ data.low ]]
Wysoki: [[ data.high ]]
O
Historia
Różnice między inwestowaniem a handlem
O
Historia
Różnice między inwestowaniem a handlem
UK100 trading gives you exposure to 100 of the largest companies on the London Stock Exchange (LSE). Otherwise known as the Financial Times Stock Exchange (FTSE) 100, this index was founded in 1984 and is now used as the benchmark for UK equity and the economy at large.
Trading on the index is open Monday to Friday, 8am until 4:30pm, London time. The UK100 trading share price is the sum of its listed companies. However, given that some companies have larger capitalisations than others, the UK100 trading price calculation is weighted.
The weighting is based on free-floating stock, which means the performance of larger companies has a greater impact on the UK100 price than smaller companies. The UK100 trading chart is updated every second during open hours. That makes it a highly liquid market and one of the most traded index funds in the world.
The UK100 trading history goes back to 1984 and with a starting value of 1,000. The individual price performances of the index’s 100 companies determine its overall value. However, the value of larger UK100 trading companies does have more of an impact than the performances of smaller companies. Looking at the average overall return of the UK100 trading price between 1984 and 2019, this index has been consistently strong. On an annualised basis, the price return of the UK100 is 5.77%, with the total return hitting 7.75%. Like all investments, the UK100 trading value can increase and decrease.
Moreover, past performances are not an indicator of future outcomes. However, this index tracks the 100 biggest companies on the London Stock Exchange. Therefore, the core assets that affect its price are solid. Other factors that can affect the price of UK100 trading shares are the UK economy, fiscal policy, the value of GBP, and Bank of England interest rates.
The way to trade UK100 shares is to buy and sell CFDs. You can’t invest in any single company and, therefore, aren’t buying stock. Instead, you’re speculating on the price movements of the 100 companies within the index.
Therefore, it’s potentially advantageous to be able to go long or short on UK100 trading price movements. So, why trade UK100 shares? Because you get indirect exposure to major companies, including Barclays, Lloyds, and Endeavour Mining.
| Swap dla długiej pozycji | [[ data.swapLong ]] punkty |
|---|---|
| Swap dla krótkiej pozycji | [[ data.swapShort ]] punkty |
| Minimalny spread | [[ data.stats.minSpread ]] |
| Średni spread | [[ data.stats.avgSpread ]] |
| Minimalny rozmiar kontraktu | [[ data.minVolume ]] |
| Minimalny krok | [[ data.stepVolume ]] |
| Prowizja i swap | Prowizja i swap |
| Dźwignia | Dźwignia |
| Godziny handlu | Godziny handlu |
* The spreads provided are a reflection of the time-weighted average. Though TradingMoon attempts to provide competitive spreads during all trading hours, clients should note that these may vary and are susceptible to underlying market conditions. The above is provided for indicative purposes only. Clients are advised to check important news announcements on our Economic Calendar, which may result in the widening of spreads, amongst other instances.
The above spreads are applicable under normal trading conditions. TradingMoon has the right to amend the above spreads according to market conditions as per the 'Terms and Conditions'.
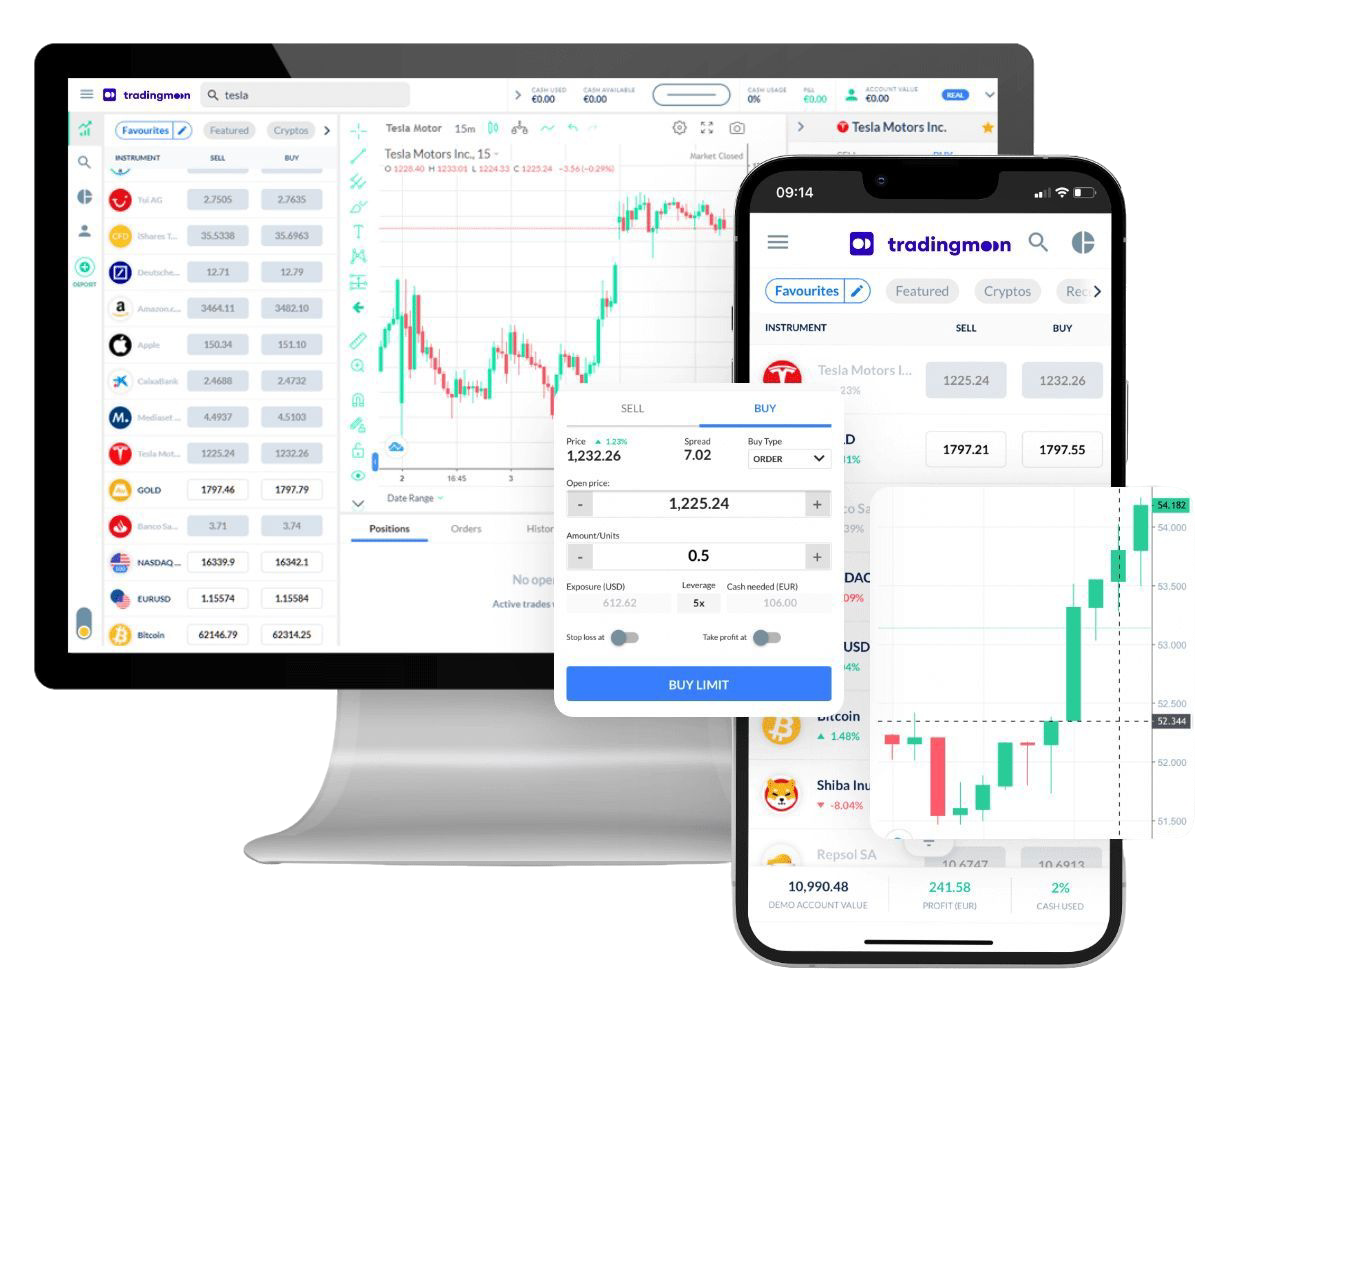
Handluj [[data.name]] z TradingMoon
Wszystkie główne indeksy w najlepszych w branży cenach.
Uzyskaj ekspozycję na rynki światowe dzięki indeksom giełdowym o niższym ryzyku.
- Handluj 24/5
- Minimalne wymagania dotyczące depozytu zabezpieczającego
- Najciaśniejsze spready
- Łatwa w użyciu platforma
Dlaczego warto handlować [[data.name]]
Wykorzystaj w pełni fluktuacje cen – bez względu na kierunek, w którym cena się zmienia i bez ograniczeń kapitałowych, które wiążą się z zakupem aktywów bazowych.
CFD
Indeksy

Zarabiaj na rosnących cenach (zajmij pozycję długą)


Wykorzystaj spadające ceny (zajmij pozycję krótką)

Handluj z dźwignią
Zajmuj większe pozycje niż gotówka, którą masz do dyspozycji

Handluj na zmienności
Nie musisz być właścicielem aktywu

Brak prowizji
Tylko niskie spready

Zarządzaj ryzykiem za pomocą narzędzi na platformie
Możliwość ustawienia poziomów take profit i stop loss