


[[ data.name ]]
[[ data.ticker ]]
[[ data.price ]] [[ data.change ]] ([[ data.changePercent ]]%)
Niski: [[ data.low ]]
Wysoki: [[ data.high ]]
O
Historia
Różnice między inwestowaniem a handlem
O
Historia
Różnice między inwestowaniem a handlem
Ubisoft (UBIP.PA) is a leading video game publisher and developer with a market cap of €3.24 billion as of 23rd June 2023. Founded in 1986 by the Guillemot brothers, Ubisoft has become synonymous with innovative gaming experiences and captivating storytelling.
The company began as a distributor of electronic products before transitioning into the gaming industry, where it found its true calling. It went public in 1996, and its shares are listed on the Euronext Paris stock exchange. With a diverse portfolio of successful franchises, such as Assassin's Creed, Far Cry, and Just Dance, the company has solidified its position as a major player in the global gaming market.
Ubisoft's growth strategy includes expanding its presence across platforms, exploring new gaming genres, and investing in emerging markets, ensuring its continued relevance in an ever-evolving industry.
Ubisoft has experienced a dynamic share price history that reflects the volatile nature of the gaming industry and the company's ability to adapt to changing market conditions.
Within the past five years, its stock hit its highest price of €107.90 in July 2018, driven by the success of its popular franchises and an optimistic outlook on the gaming market. On the other hand, the lowest stock price reached €18.06 in January 2023, which can be attributed to various internal and external factors impacting the company's performance.
To analyze the share price history and anticipate future trends, traders can employ various tools and indicators such moving averages, Relative Strength Index (RSI), and Bollinger Bands. These tools help identify potential entry and exit points, determine market sentiment, and gauge the stock's momentum.
Investors keenly monitor the stock performance, considering both the competitive landscape and the broader gaming industry trends when making investment decisions.
Before trading Ubisoft (UBIP.PA) stock, it's crucial to consider its competitors in the global gaming industry. Analyzing competitors can offer valuable insights into market trends, potential threats, and investment opportunities.
- Electronic Arts (EA.US): A leading developer and publisher of interactive entertainment, EA is known for franchises like FIFA, Battlefield, and The Sims.
- Activision Blizzard (ATVI.US): This gaming giant owns popular titles such as Call of Duty, World of Warcraft, and Overwatch, making it a strong contender in the market.
- Nintendo (7974.T): As a pioneer in the gaming industry, Nintendo offers both hardware and software products, including the popular Switch console and iconic franchises like Mario and Zelda.
By examining these competitors, investors may make well-informed decisions when trading Ubisoft's stock, taking into account the competitive landscape and potential growth opportunities within the gaming industry.
| Swap dla długiej pozycji | [[ data.swapLong ]] punkty |
|---|---|
| Swap dla krótkiej pozycji | [[ data.swapShort ]] punkty |
| Minimalny spread | [[ data.stats.minSpread ]] |
| Średni spread | [[ data.stats.avgSpread ]] |
| Minimalny rozmiar kontraktu | [[ data.minVolume ]] |
| Minimalny krok | [[ data.stepVolume ]] |
| Prowizja i swap | Prowizja i swap |
| Dźwignia | Dźwignia |
| Godziny handlu | Godziny handlu |
* The spreads provided are a reflection of the time-weighted average. Though TradingMoon attempts to provide competitive spreads during all trading hours, clients should note that these may vary and are susceptible to underlying market conditions. The above is provided for indicative purposes only. Clients are advised to check important news announcements on our Economic Calendar, which may result in the widening of spreads, amongst other instances.
The above spreads are applicable under normal trading conditions. TradingMoon has the right to amend the above spreads according to market conditions as per the 'Terms and Conditions'.
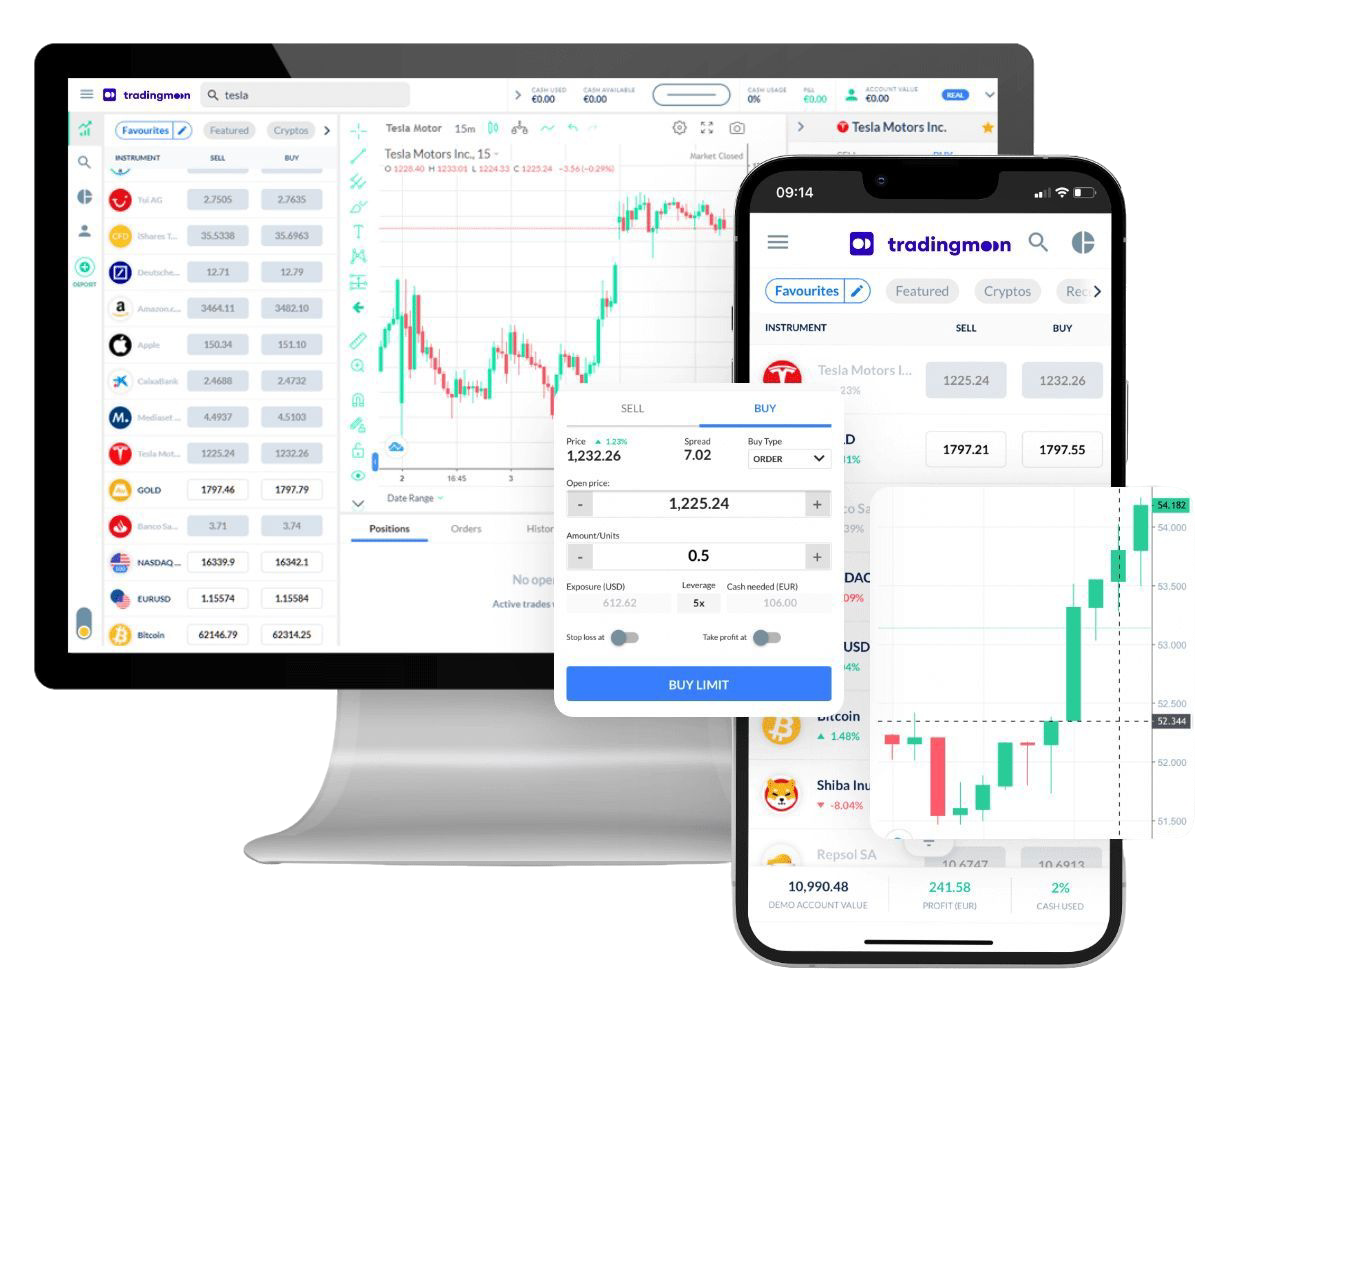
Handluj [[data.name]] z TradingMoon
Wszystko bezproblemowo z elastycznymi rozmiarami transakcji i z zerową prowizją!*
- Handluj 24/5
- Minimalne wymagania dotyczące depozytu zabezpieczającego
- Bez prowizji, tylko spread
- Dostępne udziały ułamkowe
- Łatwa w użyciu platforma
*Mogą obowiązywać inne opłaty.
Dlaczego warto handlować [[data.name]]
Wykorzystaj w pełni fluktuacje cen – bez względu na kierunek, w którym cena się zmienia i bez ograniczeń kapitałowych, które wiążą się z zakupem aktywów bazowych.
CFD
Akcje

Zarabiaj na rosnących cenach (zajmij pozycję długą)


Wykorzystaj spadające ceny (zajmij pozycję krótką)

Handluj z dźwignią
Zajmuj większe pozycje niż gotówka, którą masz do dyspozycji

Handluj na zmienności
Nie musisz być właścicielem aktywu

Brak prowizji
Tylko niskie spready

Zarządzaj ryzykiem za pomocą narzędzi na platformie
Możliwość ustawienia poziomów take profit i stop loss