
[[ data.name ]]
[[ data.ticker ]]
[[ data.price ]] [[ data.change ]] ([[ data.changePercent ]]%)
Minim: [[ data.low ]]
Maxim: [[ data.high ]]
Despre
Istoric
Diferențe între investiții și tranzacționare
Despre
Istoric
Diferențe între investiții și tranzacționare
US30 Industrial Average, cunoscut ca US30 sau US30, este un indice bursier bazat pe 30 dintre cele mai importante companii de pe diferitele burse de valori care operează în SUA.
Acesta este un indice ponderat după preț, cu un focus mai îngust decât indici precum SPX500, care acoperă mai multe companii. Cu toate acestea, cu o istorie care datează din 1896, longevitatea acestui indice înseamnă că prețul US30 este încă urmărit de mulți experți financiari și stă la baza numeroaselor tipuri de investiții.
Deși numele complet al indicelui include cuvântul „industrial", acesta nu mai reflectă compoziția actuală. Cele 30 de companii pe care le urmărește indicele provin din tot felul de industrii, de la băuturi răcoritoare la servicii financiare și îmbrăcăminte. Unele dintre cele mai cunoscute companii din lume sunt incluse în acest indice, precum Walmart, Apple, Microsoft, JPMorgan Chase și Coca-Cola. Companiile listate pe acesta se schimbă din când în când, un comitet decidând asupra oricăror modificări. Niciuna dintre firmele incluse în prima ediție a indicelui nu mai figurează în cea mai recentă versiune.
Indicele US30 și-a încheiat primul an de publicare cu o valoare de închidere de 39,29. La începutul secolului al XX-lea, depășise 10.000, iar 2021 a stabilit un nou record de închidere cu peste 36.000 la sfârșitul anului.
Acest preț al US30 reflectă performanța celor 30 de acțiuni individuale din componența sa și este influențat și de condițiile economice mai largi. Dacă analizăm cele mai mari câștiguri zilnice înregistrate de-a lungul anilor, putem observa că acestea au apărut parțial din cauza unor evenimente majore, precum adoptarea Legii bancare de urgență din 1933, care a adus stabilitate sistemului bancar american și a condus la o creștere de 15,34% a acestui indice.
În același mod, cele mai mari scăderi ale prețului US30 sunt legate de date precum Lunea Neagră din 1987 și Criza de pe Wall Street din 1929. Încercarea de a anticipa următoarea prăbușire sau creștere semnificativă a prețului US30 este unul dintre principalele obiective pentru mulți profesioniști din piața bursieră.
Deoarece acesta este un indice, nu puteți cumpăra direct acțiuni în el. Cu toate acestea, există o piață uriașă pentru produse financiare bazate pe prețul US 30. Contractele futures și de opțiuni bazate pe indice sunt intens tranzacționate, aceste opțiuni fiind utilizate de obicei de traderi mai experimentați sau de cei dispuși să învețe abilități cheie.
Fondurile de indici, precum fondurile mutuale, urmăresc și încearcă să egaleze performanța US30, deși investitorii pot fi nevoiți să plătească comisioane care reduc performanța sub nivelul indicelui însuși. Printre avantajele investiției într-un fond care urmărește acest tip de indice bursier se numără faptul că acesta creează automat un portofoliu diversificat în comparație cu achizițiile de acțiuni individuale.
| Swap lung | [[ data.swapLong ]] puncte |
|---|---|
| Swap scurt | [[ data.swapShort ]] puncte |
| Spread min | [[ data.stats.minSpread ]] |
| Spread mediu | [[ data.stats.avgSpread ]] |
| Dimensiune minimă contract | [[ data.minVolume ]] |
| Dimensiune minimă pas | [[ data.stepVolume ]] |
| Comision și swap | Comision și swap |
| Levier | Levier |
| Ore de tranzacționare | Ore de tranzacționare |
* Spreadurile indicate reprezintă o medie ponderată în timp. Deși TradingMoon încearcă să ofere spreaduri competitive pe durata tuturor orelor de tranzacționare, clienții trebuie să țină cont că acestea pot varia și sunt influențate de condițiile pieței suport. Informațiile de mai sus sunt furnizate doar în scop orientativ. Clienții sunt sfătuiți să verifice anunțurile importante din Calendarul nostru Economic, care pot duce la lărgirea spreadurilor, printre alte situații.
Spreadurile de mai sus se aplică în condiții normale de tranzacționare. TradingMoon își rezervă dreptul de a modifica spreadurile de mai sus în funcție de condițiile de piață, în conformitate cu „Termenii și Condițiile".
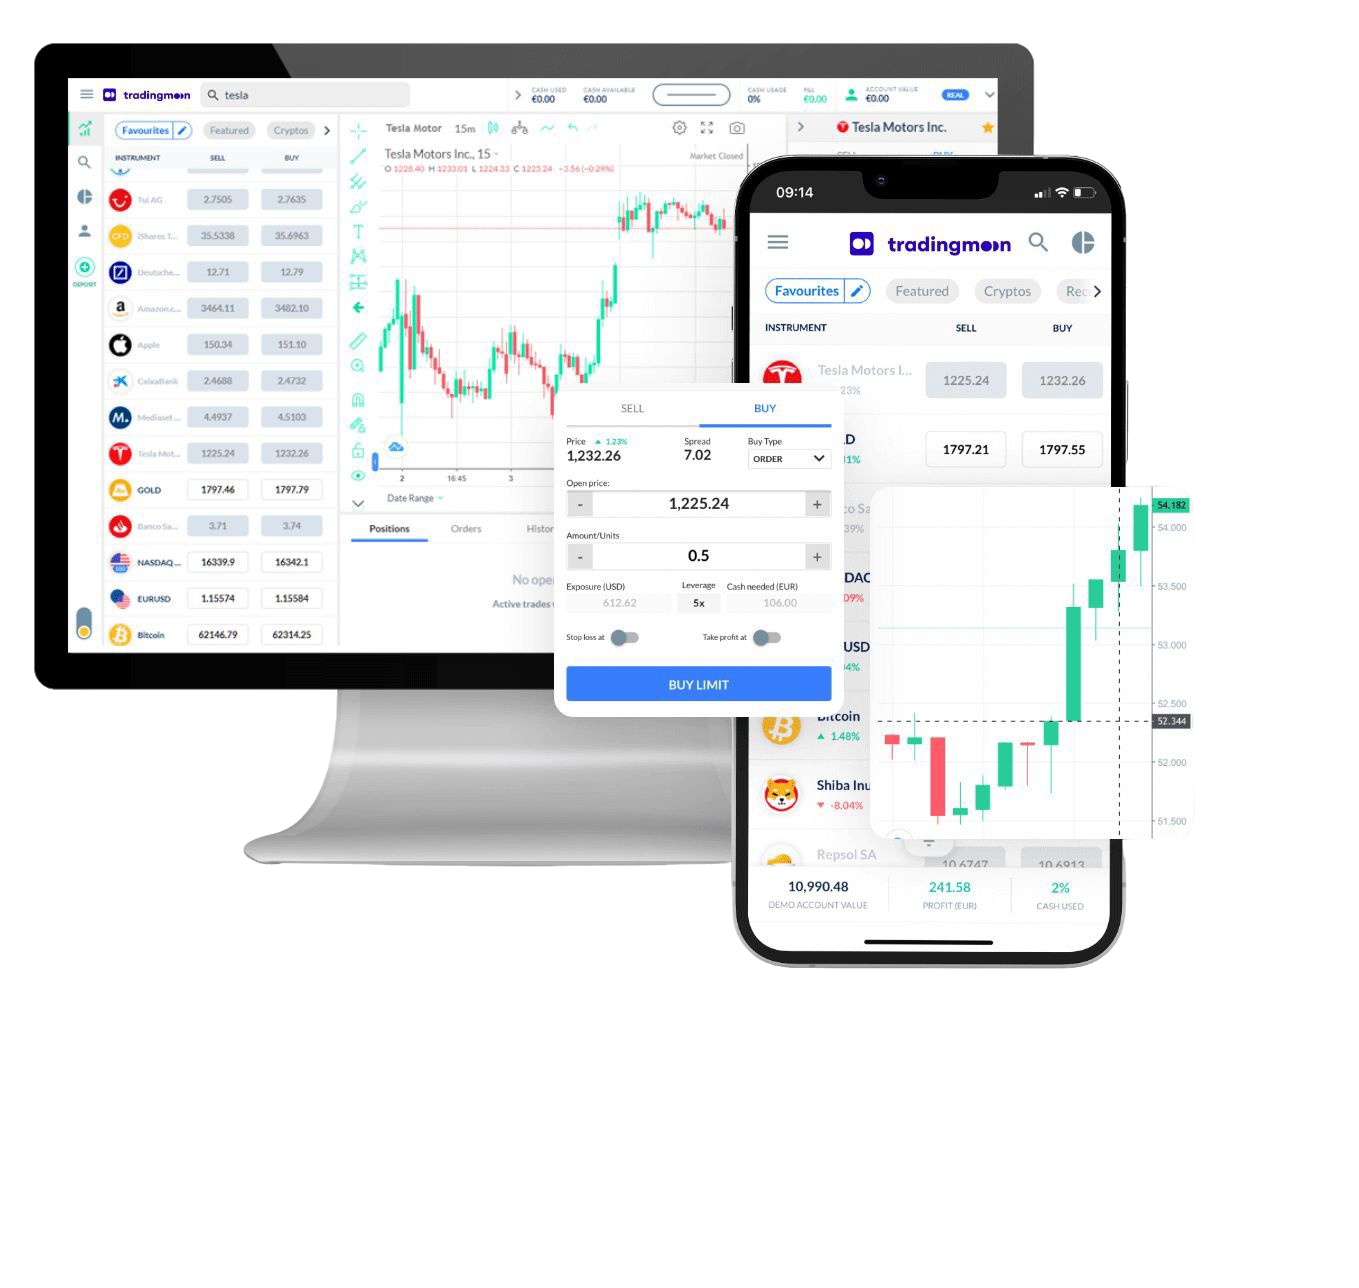
Tranzacționează [[data.name]] cu TradingMoon
Toți indicii majori la prețuri de top din industrie.
Obțineți expunere la piețele globale prin indici bursieri cu risc mai scăzut.
- Tranzacționați 24/5
- Cerințe minime de marjă
- Cele mai strânse spreaduri
- Platformă ușor de utilizat
De ce să tranzacționezi [[data.name]]
Profitați la maximum de fluctuațiile de preț — indiferent de direcția în care evoluează prețul și fără restricțiile de capital asociate cumpărării activului suport.
CFD-uri
Indicii
Profitați de prețurile în creștere (poziție long)
Profitați de scăderea prețurilor (deschideți o poziție short)
Tranzacționați cu levier
Dețineți poziții mai mari decât numerarul disponibil
Tranzacționați pe volatilitate
Nu este nevoie să dețineți activul
Fără comisioane
Doar spreaduri mici
Gestionați riscul cu instrumente din platformă
Posibilitatea de a seta niveluri de take profit și stop loss